
Weekly Special | September 4, 2016
Is Tallahassee Inching Towards A Sellers’ Market?
What a difference a year or two marks when looking at supply and demand in the Tallahassee housing market.
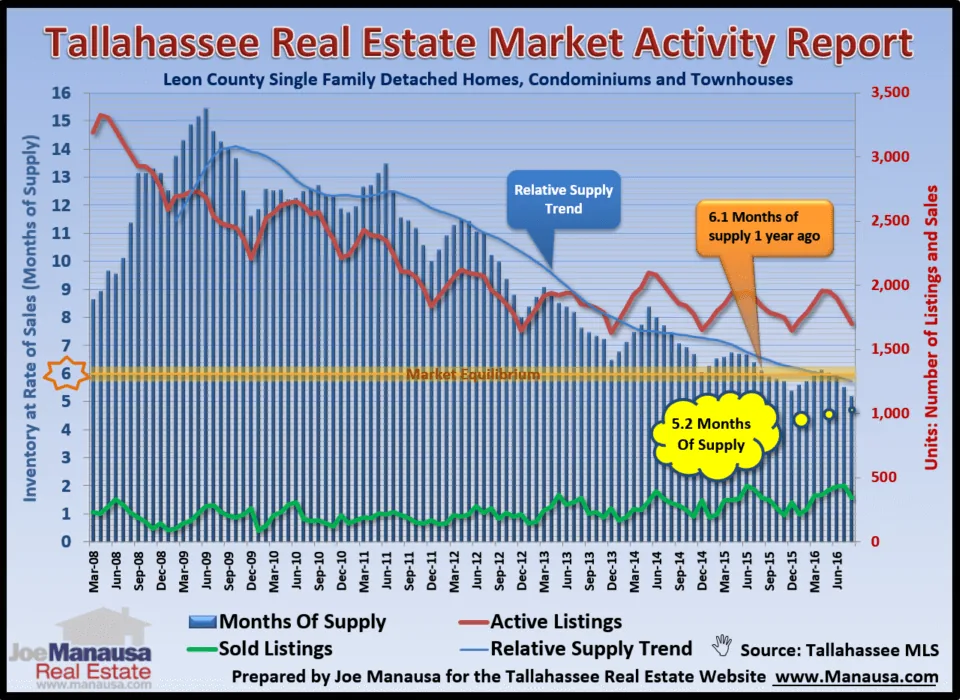
After 8 long years of glut and over-supply, we are now looking at pockets of scarcity, where the number of buyers exceeds the sellers in the market.
For these areas and price ranges, we are indeed entering a sellers’ market.
The graph above depicts the relative supply of homes for sale for the entire Leon County (Tallahassee) market. That means it does not distinguish between areas and price ranges, rather it gives us an overview of where we stand today.
The red line measures the current number of homes for sale each month, while the green line shows the total number of homes sold each month, both are measured on the right vertical axis.
The blue bars measure the relative supply of homes, reported in “months of supply” on the left vertical axis. The gold line shows “market equilibrium” … the level where the market is balanced between sellers and buyers.
The relative supply trend has definitely crossed below the equilibrium line, meaning that (overall) we are heading towards a sellers’ market.
Expect to see appreciation begin to accelerate for those hot areas where homes are actually undersupplied.
Hopefully, appreciation in the hot areas will push some buyers to West side of town and help balance the market there.
The original one-page Weekly Special PDF is still available.
Get the Weekly Special Every Monday
Each Monday morning the Weekly Special takes one Tallahassee housing question, answers it with a chart of local sales, and explains what it means for your next move.
It is free, and you can unsubscribe any time.