
Weekly Special | October 8, 2015
Just How Far Along Is The Housing Recovery?
There are many different ways to assess the housing market recovery, but if I were wanting to sell a home, my primary concern would be related to the restoration of home values.
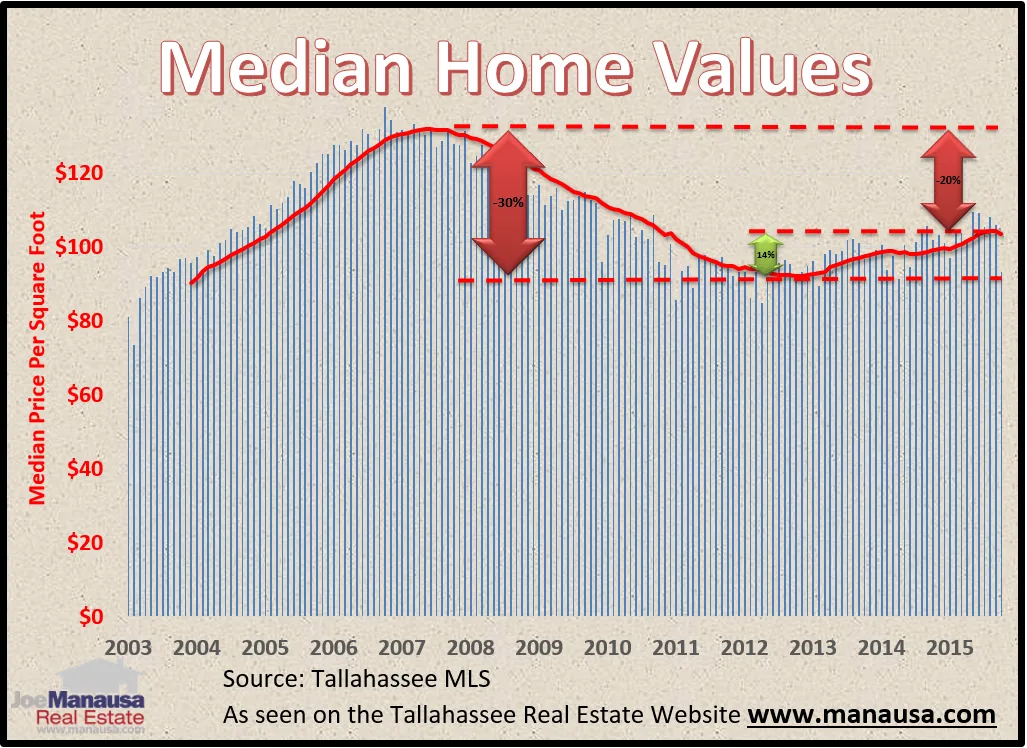
The graph above shows the median home value of homes sold and recorded in the Tallahassee MLS each month from the beginning of 2003 through today.
There are three changes that are identified with double-ended arrows. The one on the left shows that from peak to trough, the market saw median home values fall 30% across the board.
The arrow on the far right shows that current values are roughly 20% below those recorded at the peak, while the green arrow in the center shows that median values are up about 14% since the bottom of the market in 2012. (For those of you wondering how 30-20=14, ask your favorite math-friend).
Equity Gaps This means that the market is improving, but there are still tens of thousands of homeowners in our area who purchased or refinanced their home over the past ten plus years who very likely owe more on their homes than they could gain through a sale.
As home values continue to climb, we will see more of these owners become equity owners and thus be able to sell their homes and join the growing buyer pool.
The original one-page Weekly Special PDF is still available.
Get the Weekly Special Every Monday
Each Monday morning the Weekly Special takes one Tallahassee housing question, answers it with a chart of local sales, and explains what it means for your next move.
It is free, and you can unsubscribe any time.