
Weekly Special | March 13, 2016
Rising Values Free Underwater Homeowners
The study of existing home sales in Tallahassee produces an interesting picture of the current housing market.
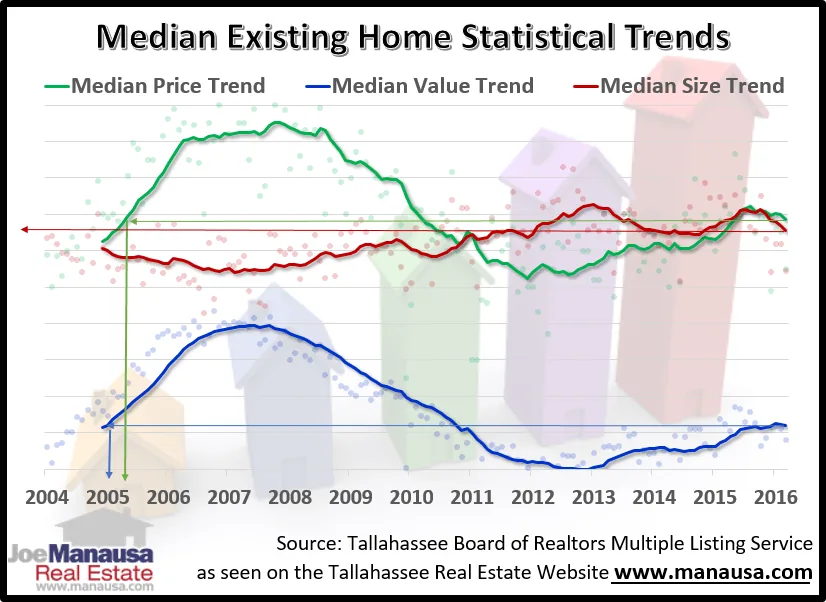
The graph above shows the change in three key median measurements when looking at existing home sales (meaning resales only, new construction has been omitted).
The green line tracks the one-year trend of the median home price. Currently, buyers are spending the same amount of money as they were in the Summer of 2005.
The blue line shows the one-year trend of the median home value (measured in price per square foot). Currently, homes are selling for the same amount as they were at the beginning of 2005.
Finally, the red line records the median home size (measured in heated and cooled square feet). This line shows that buyers are still getting larger homes than they were 10+ years ago.
Ultimately, this report shows that buyers are seeing a decline in their buying power, as they no longer are spending more money (green line), and the homes that they are buying are getting smaller.
This is supported by the blue line showing that sellers are finally getting more money for their homes.
The average price per square foot of the median existing home sold has been rising since the end of 2012, and this is very good news for Tallahassee, as fewer homeowners are underwater with their mortgages and can move when ready.
The original one-page Weekly Special PDF is still available.
Get the Weekly Special Every Monday
Each Monday morning the Weekly Special takes one Tallahassee housing question, answers it with a chart of local sales, and explains what it means for your next move.
It is free, and you can unsubscribe any time.