
Weekly Special | December 16, 2024
Current Market Conditions For Your Home
If you own a home in Tallahassee, you might wonder how it would fare on the market right now. Some homes are still going up in value, others have stalled, and some have even given back some of their gains.
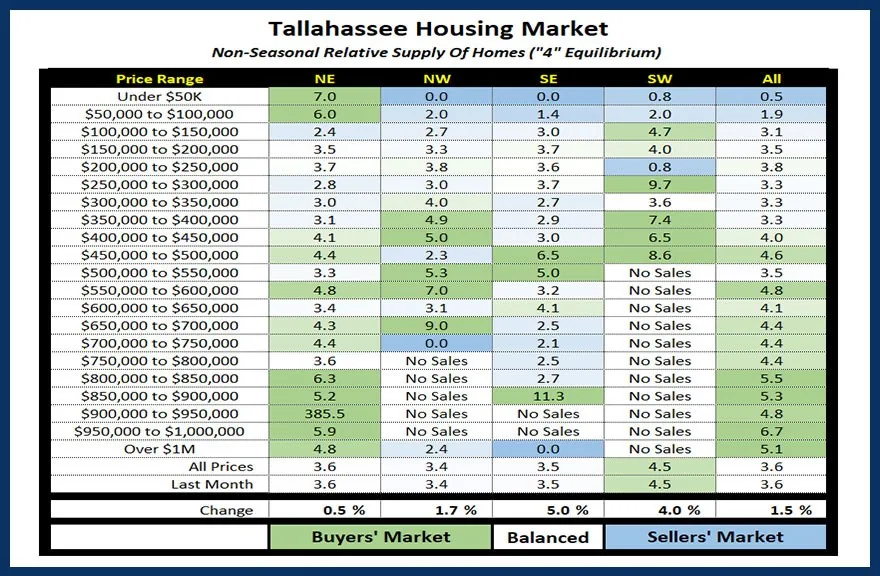
The table above is something we produce each month to ensure we are giving accurate advice to sellers when they price their homes, and to buyers so they understand how negotiations should unfold.
The table shows the relative supply of homes for sale (the months of supply of homes based upon current demand), using 4.0 months of supply as market equilibrium (the level that balances control between buyers and sellers).
The results are color coded with a heat map. The darkest green shades are the strongest buyers’ markets, while the darkest blue shades reveal sellers’ market conditions. The boxes with little to or no color are balanced.
At the bottom of the table, we see that inventory grew by 1.5% across Leon County, with the SE quadrant leading the charge with a 5% increase.
Above that we see that the market’s level of 3.6 months of supply favors buyers overall, but SW Tallahassee has crossed the line into a buyers’ market.
Current Conditions For Your Home For you to determine specific conditions for your home, you need to know your home’s value (find it here).
Once you have that, just choose the quadrant where the home is located and the price range that includes your value.
For example, any home in NE Leon County valued over $800,000 is now competing in a buyers’ market.
The original one-page Weekly Special PDF is still available.
Get the Weekly Special Every Monday
Each Monday morning the Weekly Special takes one Tallahassee housing question, answers it with a chart of local sales, and explains what it means for your next move.
It is free, and you can unsubscribe any time.