
Weekly Special | July 6, 2018
Low Inventory Of Homes Continues To Decline
The inventory of homes for sale in Tallahassee has gone from too low to even lower.
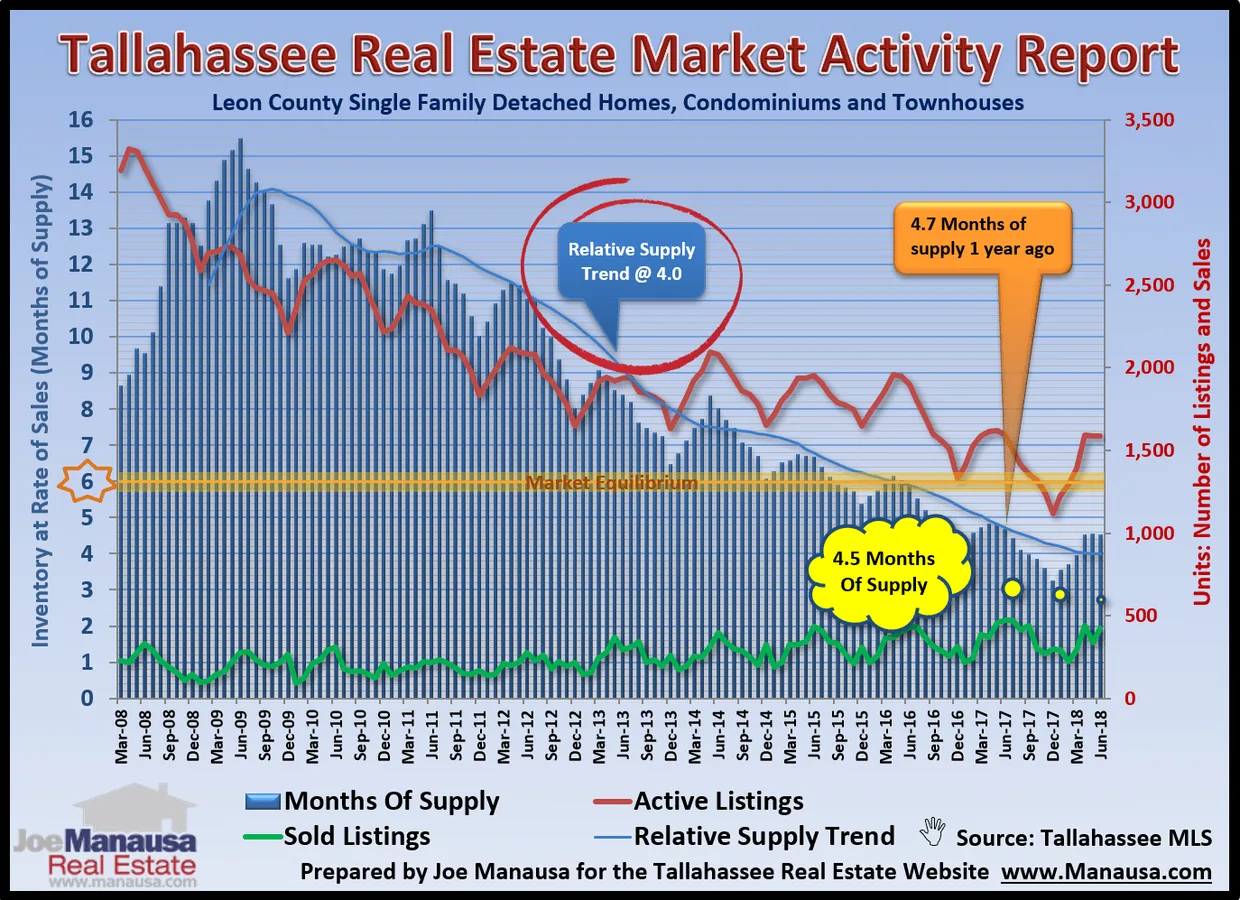
The graph above measures the relative inventory of homes for sale … meaning the current supply of homes relative to the current rate of demand, expressed in months of supply.
One interpretation is that the current 4.5 months of supply of homes for sale is only enough to satisfy 1/3rd of the homebuyers for the next 12 months.
Typically, we like to see 6.0 months of supply and we refer to this optimum supply level as market equilibrium (represented by the gold band in the graph).
When relative supply exceeds 6.0 months, we call this a buyers’ market. When relative supply falls below 6.0 months, we refer to this as a sellers’ market.
Right now we are in a strong sellers’ market for many price ranges in different sectors of the Tallahassee real estate market.
The growth in demand has cooled, but the rate of demand is still far above our ability to feed it.
If homebuilders do not increase production levels very soon, we are going to see a very significant rise in home appreciation rates.
We’ll keep an eye on the relative supply of homes and continue to report back to you as changes transpire or market activity makes a change.
The original one-page Weekly Special PDF is still available.
Get the Weekly Special Every Monday
Each Monday morning the Weekly Special takes one Tallahassee housing question, answers it with a chart of local sales, and explains what it means for your next move.
It is free, and you can unsubscribe any time.