
Weekly Special | April 2, 2016
March Home Sales Crush Last Year’s Figures
We usually wait a few more days to report on year over year home sales, as there will still be a few stragglers that closed in March but have not yet been recorded in the Tallahassee MLS. But even without the few remaining sales, the results for this March were spectacular.
As of the writing of this report, there were 335 existing homes sold in Tallahassee in March versus only 299 existing homes sold last year.
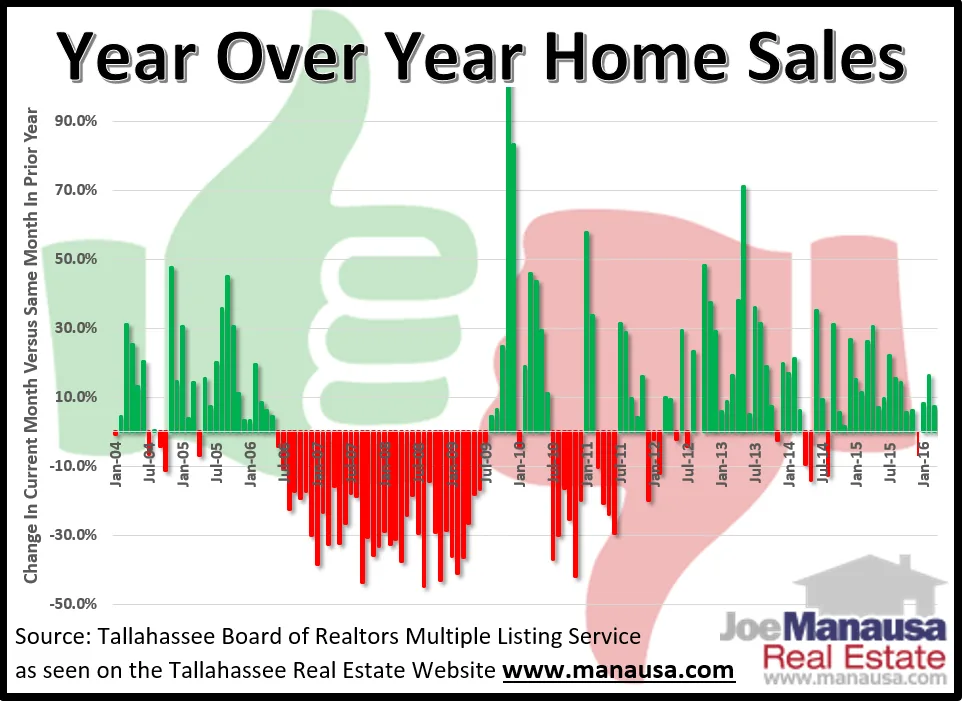
In the graph above, we compare the number of existing homes sold each month to the number sold in the same month of the prior year.
If sales were better, the column is colored green and extends upward showing the percentage gain over the same month in the previous year. If sales declined, the column is colored red and falls downward, also reporting the percentage change.
If you look towards the right side of the graph above, you’ll notice a whole lot more green than red. This is very good.
There is a very strong recovery trend occurring in the Tallahassee real estate market.
Through March, an amazing 39 months out of the past 44 months have reported year over year gains, while only five posted declines.
To make this clear, only five months have shown declines since July 2012. Tallahassee is in the full throes of a housing market recovery, it’s safe to come out and play when you’re ready!
The original one-page Weekly Special PDF is still available.
Get the Weekly Special Every Monday
Each Monday morning the Weekly Special takes one Tallahassee housing question, answers it with a chart of local sales, and explains what it means for your next move.
It is free, and you can unsubscribe any time.