
Weekly Special | July 15, 2019
Eight Year Trend Says Stronger Home Sales
Last week’s report revealed why I am bullish on the future of the housing market, and I had some people ask if I could support my claim with another view of the data.
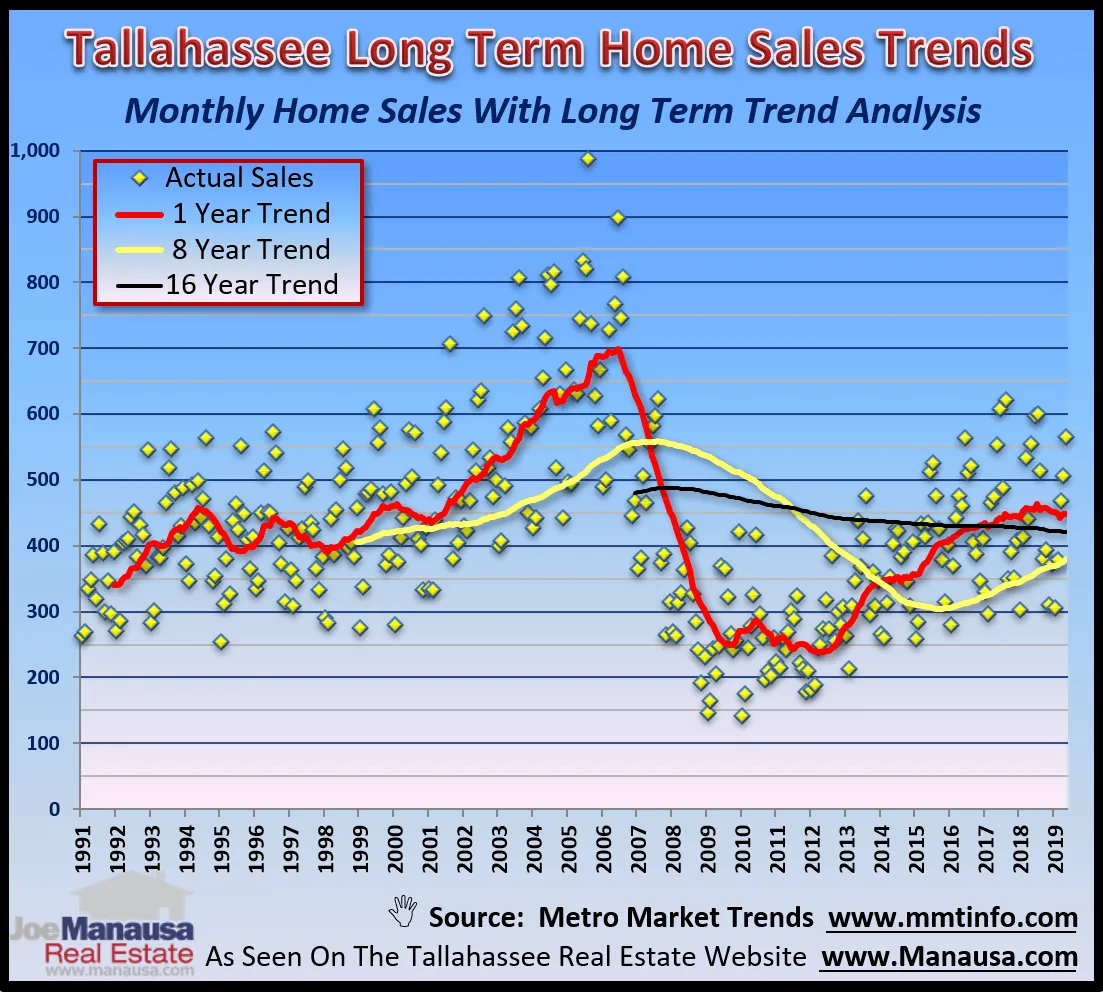
The graph above is one that I’ve used for more than ten years, and with the help of one of my long-term readers a long time ago, has become the standard for evaluating the cyclic trends in the Tallahassee housing market.
I used to report the one, five, and ten-year trends for home sales, but he pointed out that our cycle length seemed to best-fit an eight year duration.
The number of homes sales each month are shown as yellow dots, the the one, eight, and sixteen-year trends have been plotted.
If the cycles continue as they have for the past thirty years, we are only 1/2 of the way through the eight-year up-cycle for home sales. The majority of recent months have been above the eight-year trend, which I believe supports a bullish outlook. Thoughts?
The original one-page Weekly Special PDF is still available.
Get the Weekly Special Every Monday
Each Monday morning the Weekly Special takes one Tallahassee housing question, answers it with a chart of local sales, and explains what it means for your next move.
It is free, and you can unsubscribe any time.