
Weekly Special | March 26, 2017
How We Read The Skew Of The Housing Market
The two measurements in the graph above, when shown together as they are, shed light on stage of the real estate recovery.
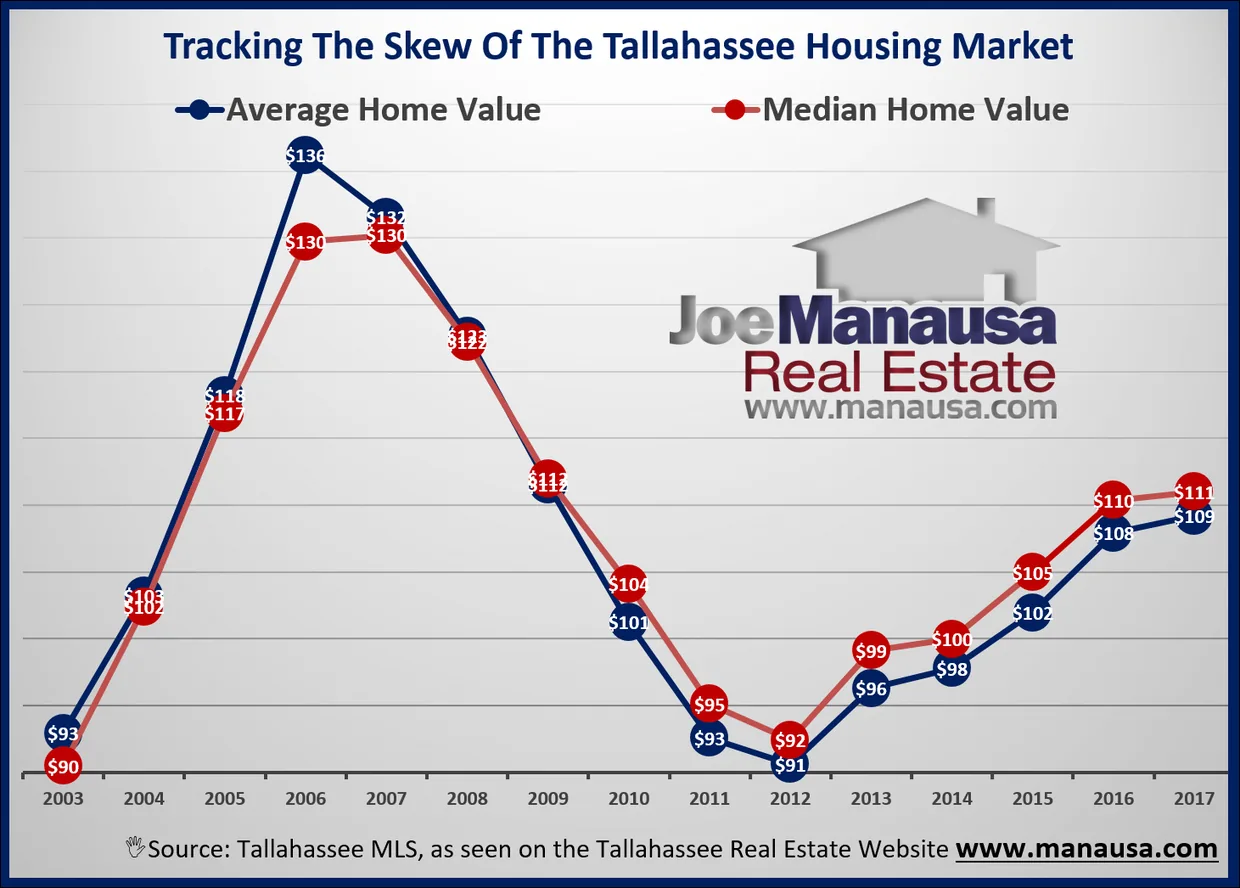
The blue line measures the “average” (mean) home value reported each month in the Tallahassee MLS (measured in price per square foot), while the red line reports the “middle” (median) value.
The Skew Of The Housing Market The difference between the median and the mean is called the skew, and by tracking the trend of the skew we can get a good idea of how far along the housing market recovery has progressed.
During the explosion of the market from 2002 through 2006, note how average values were higher than median values. This means there were more “high values” farther away from the middle than were the “low values.” In other words, buyers were loose with their money.
But that trend reversed in 2009 and continues today, with average values lower than median values. This means there have been more “low values” farther away from the middle than have been the “high values.” In other words, buyers have been tight with their money.
But the two measurements are drawing close together, and I suspect we will see them cross-over sometime before Summer next year.
When this occurs, we will see crazy levels of appreciation, similar to what Tallahassee recorded 15 years ago.
This issue went with a longer report on our blog: read the full blog post. The original one-page Weekly Special PDF is still available.
Get the Weekly Special Every Monday
Each Monday morning the Weekly Special takes one Tallahassee housing question, answers it with a chart of local sales, and explains what it means for your next move.
It is free, and you can unsubscribe any time.