
Weekly Special | December 30, 2019
Buyer Beware: Competition Reaches All-Time High
Low inventory of homes for sale, combined with high demand from homebuyers results in market conditions that we have not experienced in the past 12 years or more.
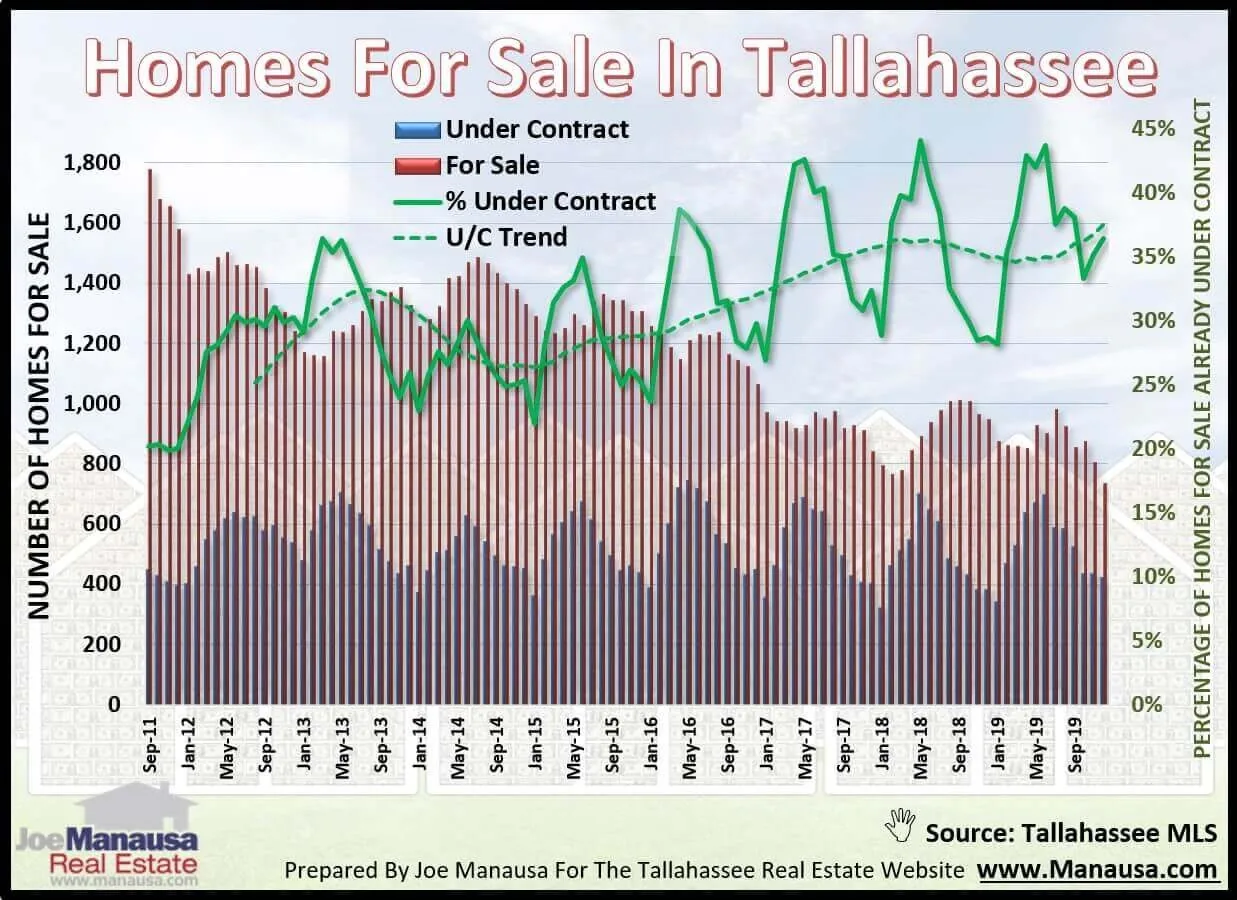
The graph above portrays a picture of the scarcity of the current inventory of single-family detached homes, condominiums and townhouses.
The total number of homes on the market each month is shown as a stack of homes for sale not under contract (red) plus homes for sale that are currently under contract with buyers (blue).
The green line, measured on the right vertical axis, shows the percentage of existing inventory that is already spoken for. The dotted green line shows the average for the past twelve months.
What this means is that when buyers go out to choose a home, more than 1/3rd of what they see for sale has already been claimed by another buyer.
Buyers – Be Prepared!
The numbers above are not equally spread across all price ranges, so it’s important for buyers to understand this dynamic for the area and price range for the type of home they want to buy. Buyers must be prepared to jump on a home that they like, or risk losing it to a better-prepared buyer.
The original one-page Weekly Special PDF is still available.
Get the Weekly Special Every Monday
Each Monday morning the Weekly Special takes one Tallahassee housing question, answers it with a chart of local sales, and explains what it means for your next move.
It is free, and you can unsubscribe any time.