

Weekly Special | September 23, 2019
Recovery Differences By Zip Code
The real estate market in Tallahassee continues to improve, with property values today setting new record highs in some areas while still playing catch-up in others.
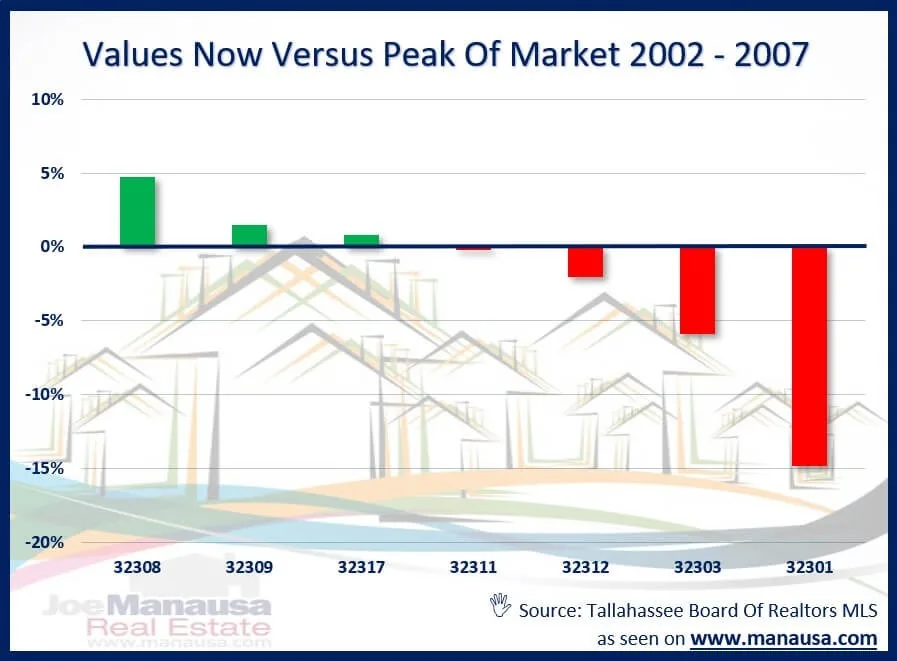
The graph above shows the percentage change in average price per square foot from the peak of the market though today for existing single-family detached homes (meaning no new construction homes) and it is segmented by zip code.
This is a convenient way to get a feel for overall home values, though it is not an effective method for determining the value of a particular home. So what does this graph tell us in terms of home values today versus those in 2006 and 2007?
Well, first and foremost it shows that the real estate market recovery has not been fairly distributed across the entire Tallahassee real estate market.
Today’s Values Vs. Market Peak Zip codes did not peak at the exact same time, so it is unsurprising that the recovery is not synchronized either.
32308 – Up 4.7% 32309 – Up 1.5% 32317 – Up 0.8% 32311 – Down 0.2% 32312 – Down 2.0% 32303 – Down 5.9% 32301 – Down 14.8% The 32308 zip code is leading all other Tallahassee zip codes in the recovery. The student areas in 32301 and 32303 are lagging the most and thus contain some of the best opportunities for obtaining a great value-buy in today’s housing market.
The original one-page Weekly Special PDF is still available.
Get the Weekly Special Every Monday
Each Monday morning the Weekly Special takes one Tallahassee housing question, answers it with a chart of local sales, and explains what it means for your next move.
It is free, and you can unsubscribe any time.