
Weekly Special | August 5, 2019
What’s Going On In The Second Quarter?
Since 2015, an interesting trend has been dominating home value change in Tallahassee.
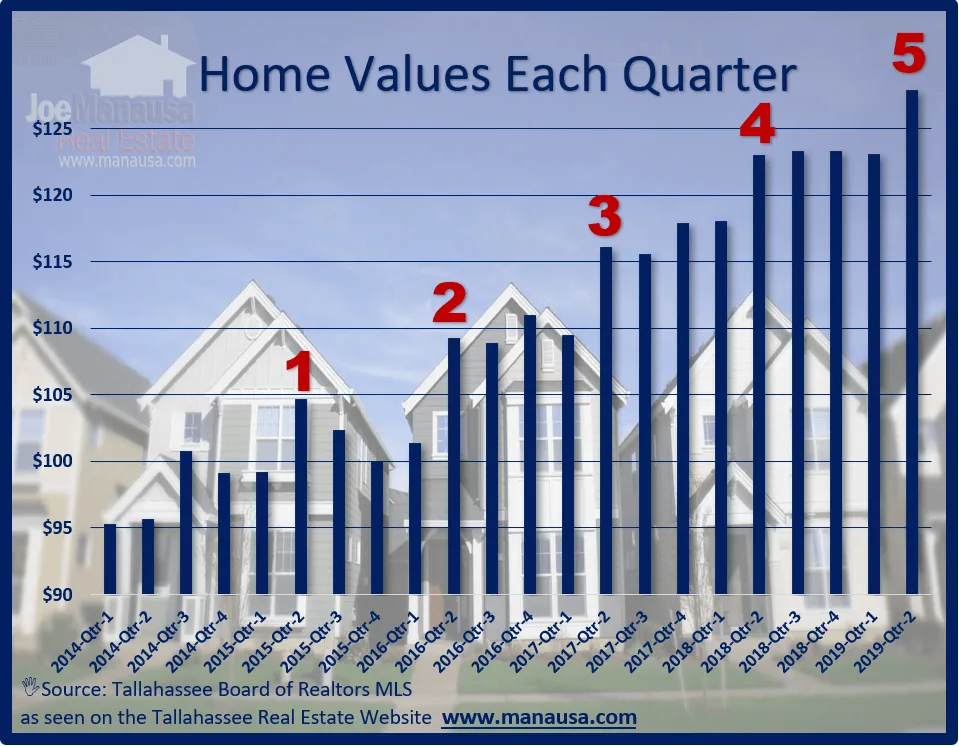
The graph above shows the average price per square foot of all homes sold each quarter, and the second quarter of each of the past five years has shown a substantial gain. More importantly, there has been little change for the following three quarters.
When I first discovered this, my immediate thought was that new construction was impacting the market with a bulk of sales during the second quarter of each year.
Once I removed the existing home sales from the data, I found it was NOT the case. When I removed all new sales from the data, the image remained very similar to what we see above.
This year, the average home value rose more than 5% in the 2nd quarter when compared to the 1st quarter, a huge rise. But the previous two quarters each showed a decline in average home values of less than a percent.
The demand for homes is the greatest in the 2nd quarter, perhaps more people feel like they “have to move” at that time, making them more susceptible to over-bidding in this low-inventory market.
The original one-page Weekly Special PDF is still available.
Get the Weekly Special Every Monday
Each Monday morning the Weekly Special takes one Tallahassee housing question, answers it with a chart of local sales, and explains what it means for your next move.
It is free, and you can unsubscribe any time.