
Weekly Special | September 4, 2023
Home Affordability Crisis Deepens
Home affordability has been tanking for years, and the problem is getting worse with each month that passes by. Tallahassee is not producing enough new homes to house our growing population, so the value of existing homes continues to skyrocket.
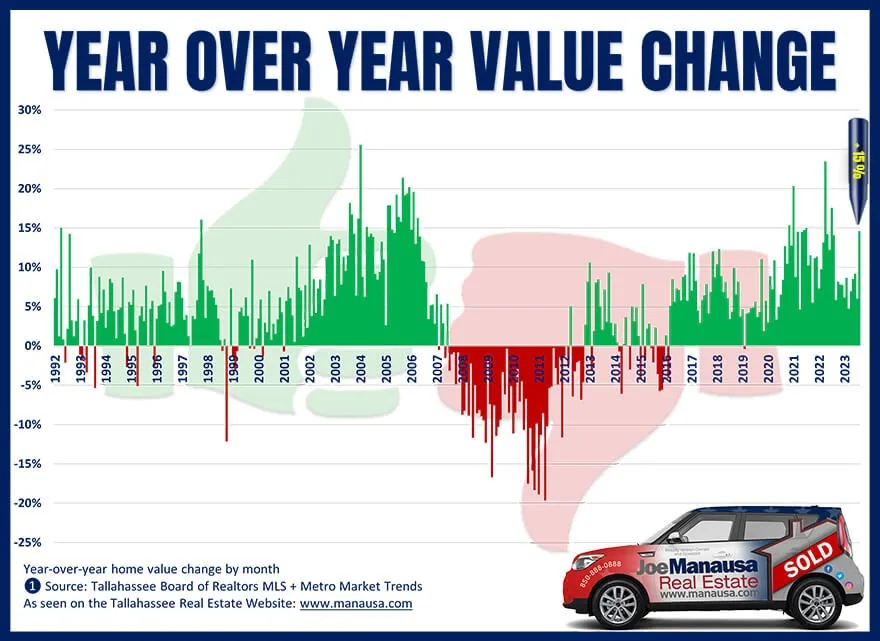
The graph above plots the year-over-year change in home values monthly (measured in price per square foot of heated and cooled space). If you observe the far right of the graph you will find that the average price per square foot of homes sold in August was nearly 15% higher than the average price per square foot of homes sold in August of last year!
It is likely that many individuals are aware that the housing market has significantly decelerated since mortgage interest rates more than doubled over a year ago. While it is reasonable to expect that a decrease in demand would correspond with a decline in home prices, other variables must also be considered.
Falling Demand, Rising Appreciation In the context of Tallahassee, it is important to note that for the past 15 years, only 9% of homes sold have been newly constructed. This implies that a staggering 91% of transactions involve existing homes.
Consequently, when demand diminishes, supply is also impacted because the majority of buyers are also home sellers. Thus, a straightforward relationship between demand and home prices is complicated by these additional factors. We need more homes!
The original one-page Weekly Special PDF is still available.
Get the Weekly Special Every Monday
Each Monday morning the Weekly Special takes one Tallahassee housing question, answers it with a chart of local sales, and explains what it means for your next move.
It is free, and you can unsubscribe any time.