

Weekly Special | August 30, 2021
How Long Can This Pace Continue?
If you have been in the market to buy and/or sell a home, then you know that today’s market is as hot as we’ve seen it in the past 15 years.
As most people pay little attention to the housing market (unless they are planning a move), they really don’t have the perspective to know whether or not the pace of home sales should keep up or slow down. Heck, if you fire up your web browser and go to YouTube, you’ll find a host of “experts” who are calling for the housing market to not just slow down, but instead, crash!
One way to gauge the market is to look at the change in population over time and compare it with the number of homes sold. I think most people would agree that an area with millions of people will record more home sales than will an area of thousands of people. So why not evaluate this ratio in Tallahassee?
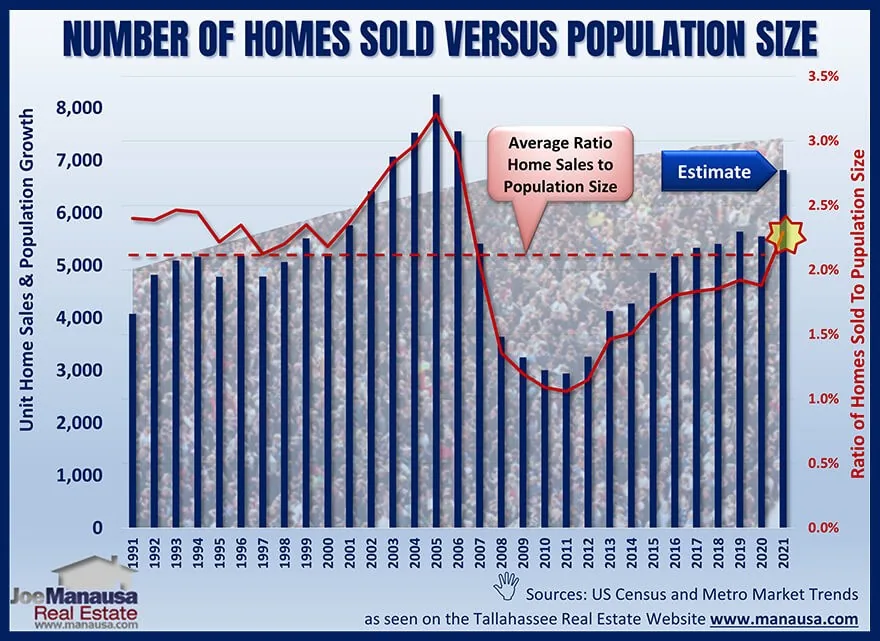
The graph above plots Leon County population (divided by 40 to fit on the graph) and the total number of homes sold. The red line reports the percentage of home sales each year compared with the total population. It turns out that over the past thirty years, the number of homes sold, on average, is equivalent to 2.1% of our total population.
For the first time in 14 years, the number of homes sold is consistent with the number sold for the 16 years prior to the housing market collapse. This year’s number of homes sold, when compared to our population size, appears to be similar to any year in the 1990s, suggesting the pace is sustainable.
The original one-page Weekly Special PDF is still available.
Get the Weekly Special Every Monday
Each Monday morning the Weekly Special takes one Tallahassee housing question, answers it with a chart of local sales, and explains what it means for your next move.
It is free, and you can unsubscribe any time.