

Weekly Special | October 5, 2020
How 2020 Home Sales Rank
Year over year home sales rose 4% higher in September when compared to September 2019 home sales. This means we’ve seen gains in two of the past three months.
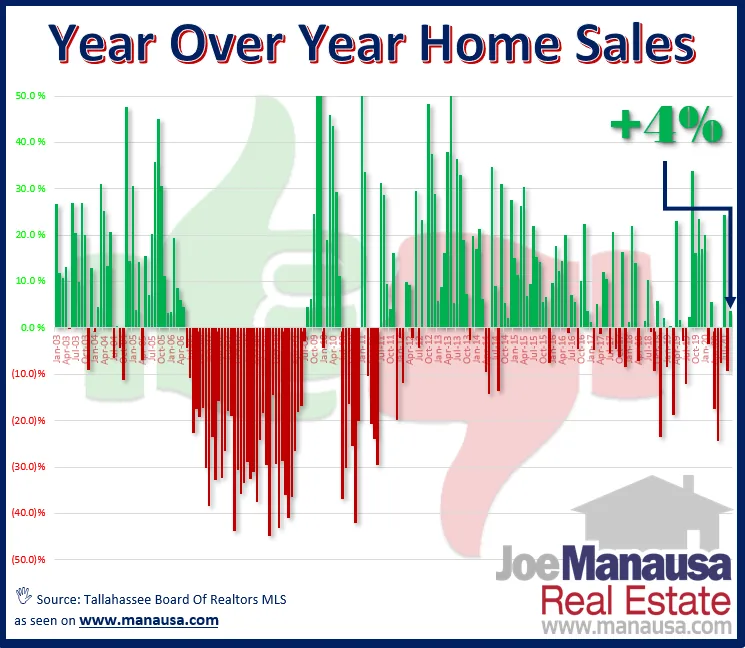
The graph above shows year over year homes sales, which is a method of tracking change in the market. The green vertical lines occur when we record more home sales in a month than we did for that same month in the prior year. In a similar manner, the red vertical lines show declines.
Strong demand has been fueled by historically-low mortgage interest rates which makes buyer s ’ purchasing power stronger (you can buy more home w/o a higher payment).
While rates remain low, so too remains the inventory of homes for sale.
We either need more sellers to enter the market, more builders to provide inventory, or we are going to continue to see home prices sky-rocket.
I am concerned about the potential for hyper-inflation in housing, where prices soar beyond buyers’ reach.
The original one-page Weekly Special PDF is still available.
Get the Weekly Special Every Monday
Each Monday morning the Weekly Special takes one Tallahassee housing question, answers it with a chart of local sales, and explains what it means for your next move.
It is free, and you can unsubscribe any time.