
Weekly Special | December 10, 2017
Year Over Year Home Sales Improve In November
Year over year (YoY) home sales were up more than 10% in November when compared to November of last year according to the Tallahassee Board of Realtors Multiple Listing Service.
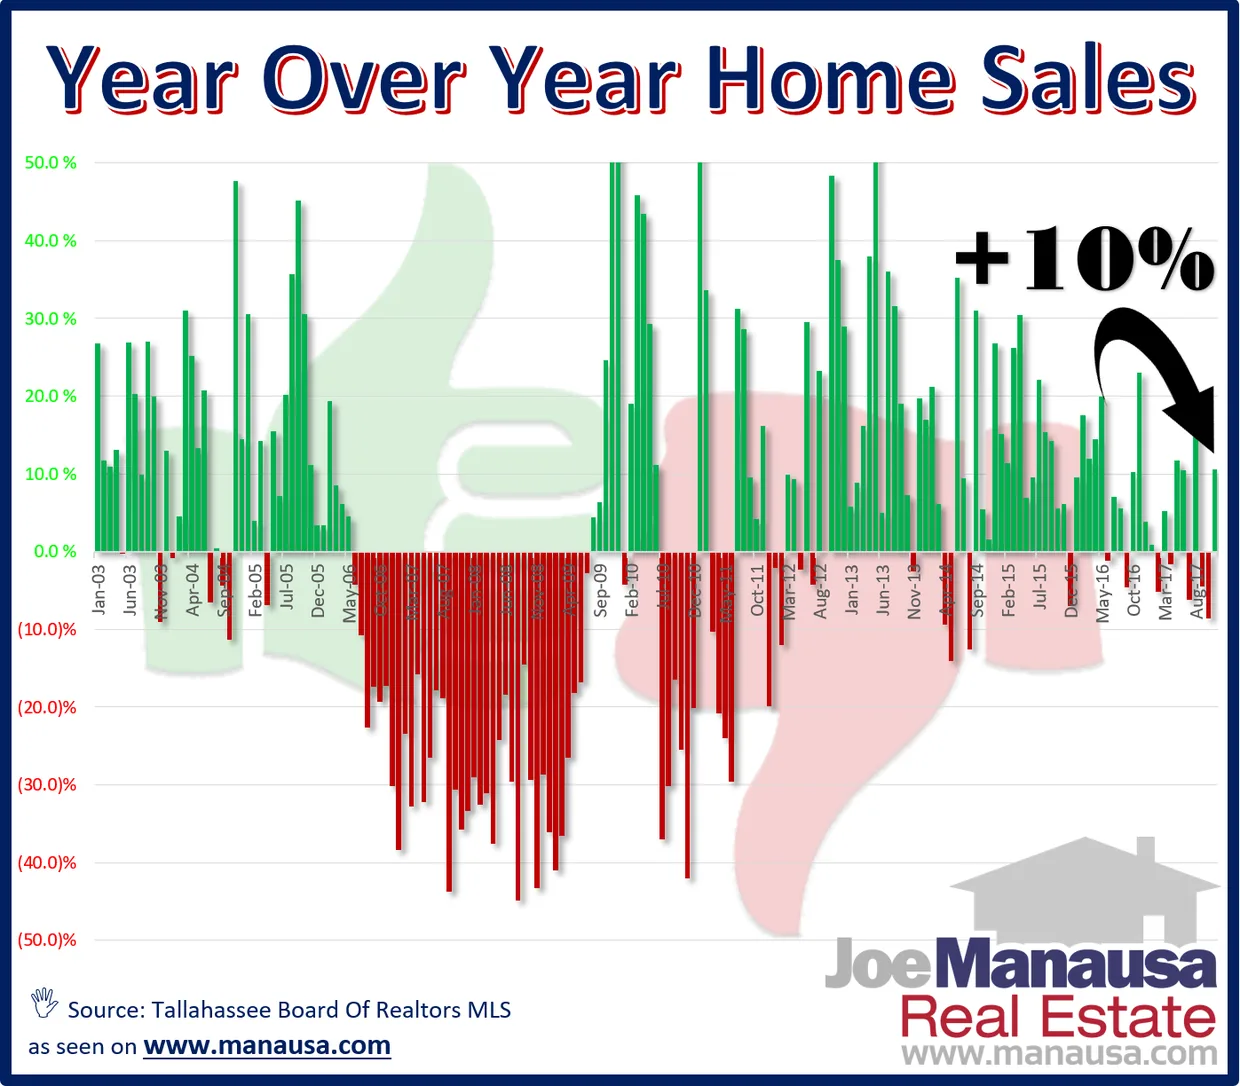
YoY performance is frequently used by real estate experts seeking to gauge whether a market’s sales performance is improving or worsening.
The graph above compares monthly home sales with the corresponding month of the previous year. When the current month reports more sales, it is plotted as a green column above the zero axis. The opposite is true for declining months and is colored red.
Over the past 24 months, only 8 months have seen a decline in home sales, though 5 of the 8 occurred this year. This means that the market is improving at a slower rate than what we experienced last year.
Demand for homes in Tallahassee remains strong, but inventory is becoming a challenge for homes under $450,000.
Expect to see NE Tallahassee yield some market share to both NW and SE Tallahassee, as lower prices and NW renovations pull median buyers away.
This issue went with a longer report on our blog: read the full blog post. The original one-page Weekly Special PDF is still available.
Get the Weekly Special Every Monday
Each Monday morning the Weekly Special takes one Tallahassee housing question, answers it with a chart of local sales, and explains what it means for your next move.
It is free, and you can unsubscribe any time.