
Weekly Special | June 10, 2024
Home Sales Down Seven Percent
Year-over-year home sales fell 7% in May, a continuing sign of a sluggish market due to multiple factors.
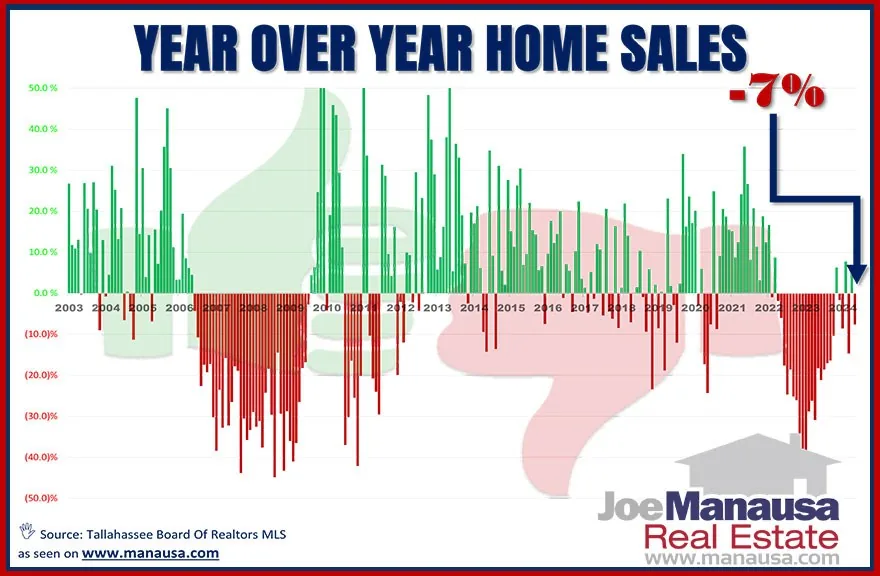
This graph is a great tool to evaluate non-seasonal fluctuations in the housing market. Each vertical bar reflects the percentage change in the number of homes sold each month when compared to the same month the year prior.
Green bars register growth while red bars report declines. After 19 consecutive monthly declines concluding in October, those of us in the real estate, mortgage, title, and supporting industries continue to see the market move to neutral with alternating months of gains and declines.
The main reasons for slow sales include very low inventory levels and mortgage shock. Homeowners feel stuck in their current homes because their mortgage rates are half of today’s rates. Ironically, today’s rates are great, well below the 50-year average, they just are much higher than the historically low rates of the past five years.
The Home Affordability Crisis Real estate (specifically housing) is a commodity, thus it is not immune to the forces of supply and demand.
The US (and Tallahassee) is facing a shortage of places to live, and inflation has pushed the cost to produce new homes to levels that most families cannot afford.
We each need to do our part in working towards a supply-side solution. We do not need new loans programs, we need new homes. Support sustainable development, reduce NIMBY and political involvement, and keep fighting for the American Dream!
The original one-page Weekly Special PDF is still available.
Get the Weekly Special Every Monday
Each Monday morning the Weekly Special takes one Tallahassee housing question, answers it with a chart of local sales, and explains what it means for your next move.
It is free, and you can unsubscribe any time.