
Weekly Special | February 10, 2025
Worst January Since 2014
In January, home sales fell 1% yearover-year, continuing the home sales cooldown from over two years ago.
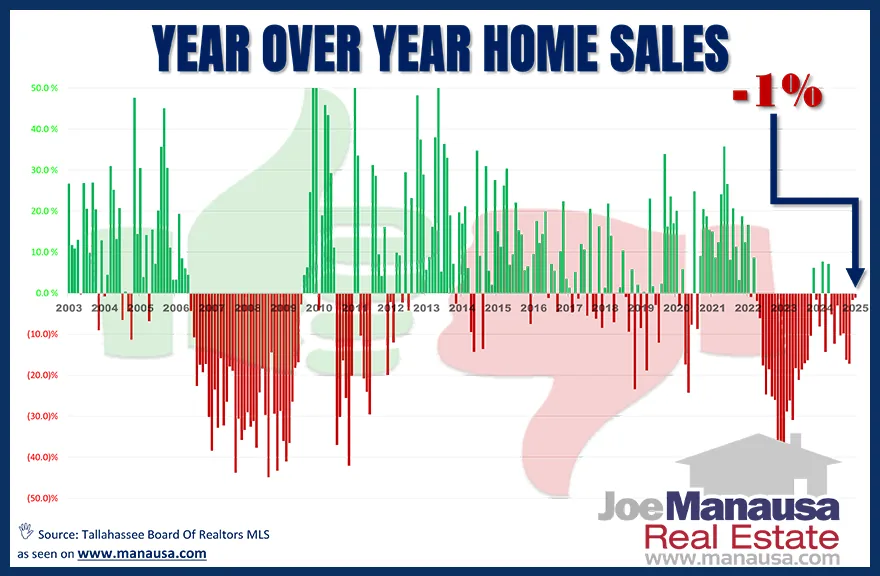
This graph effectively evaluates non-seasonal housing market fluctuations, as each vertical bar indicates the monthly percentage change in home sales compared to the same month in the previous year.
After nine consecutive monthly declines through January, we observe the market moving toward neutrality as the relative supply of homes grows slowly.
The primary reasons for slow sales include low inventory, high home prices, and mortgage shock. Homeowners feel stuck in their homes because their existing mortgage rates are half of today’s rates. Ironically, although today’s rates are appealing because they lie well below the 50-year average, they remain higher than the historically low rates of the past five years.
Newcomers to real estate worry about low home sales, but the 3,241 sales in 2024 exceed the 2,213 recorded in 2011 by 46%, although they remain 14% below the average since 2002.
What To Expect In The Spring When the market exploded in late 2000, I called it “an interest rate market,” because historically low rates allowed people to purchase far more home than they could have afforded in previous years.
The same can be said for today, it’s an interest rate market that requires lower rates to fuel demand, yet lower rates could very well ignite another price run due to the low supply of available homes. Expect the recovery to take years before any order of health is restored.
The original one-page Weekly Special PDF is still available.
Get the Weekly Special Every Monday
Each Monday morning the Weekly Special takes one Tallahassee housing question, answers it with a chart of local sales, and explains what it means for your next move.
It is free, and you can unsubscribe any time.