
Weekly Special | February 24, 2025
2nd Verse, Same As The 1st
Year-over-year home sales stayed the same in January (as of now), though it’s likely a few straggler sales will be posted and we’ll see the first year -over-year gains since April of last year.
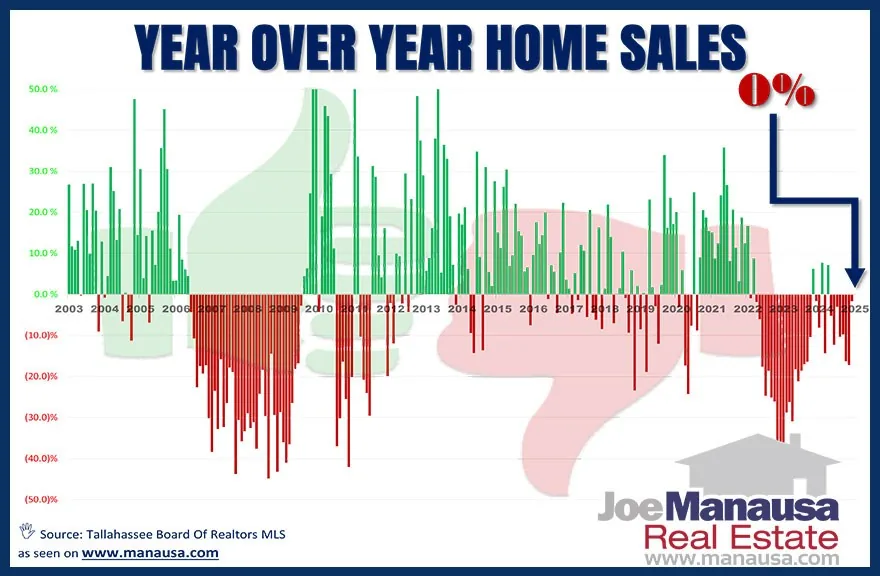
The year-over-year home sales graph effectively evaluates non-seasonal housing market fluctuations, as each vertical bar indicates the monthly percentage change in home sales compared to the same month in the prior year.
Right now, the market has been in a cooled-off mode since mortgage rates more than doubled from the historic low posted in December 2020.
Interest Rates Control Demand Today If there has ever been a housing market showing signs of interest rate sensitivity, it’s today’s housing market.
When have we ever seen demand cut in half while home prices continue to rise? The mortgage-rate lock-in effect has many would-be buyers stuck in their current homes with rates too good to let go.
Why It’s Not Just About Rates Many of us in the industry know that we have to see rates come down to the high 5% range to really get the market moving. If this were to happen, the rate lock-in effect would be less of an impact for people selling and buying, but it would create another problem.
The missing ingredient is inventory. The US stopped building starter homes fifteen years ago when the federal government changed the credit floor on the most popular loan programs.
If we see rates drop too low, we’ll see another run on homes and out of control price growth. We need more homes …
The original one-page Weekly Special PDF is still available.
Get the Weekly Special Every Monday
Each Monday morning the Weekly Special takes one Tallahassee housing question, answers it with a chart of local sales, and explains what it means for your next move.
It is free, and you can unsubscribe any time.