
Weekly Special | January 28, 2018
Home Sales Down From One Year Ago
Home sales declined .7% in December when compared to December 2016.
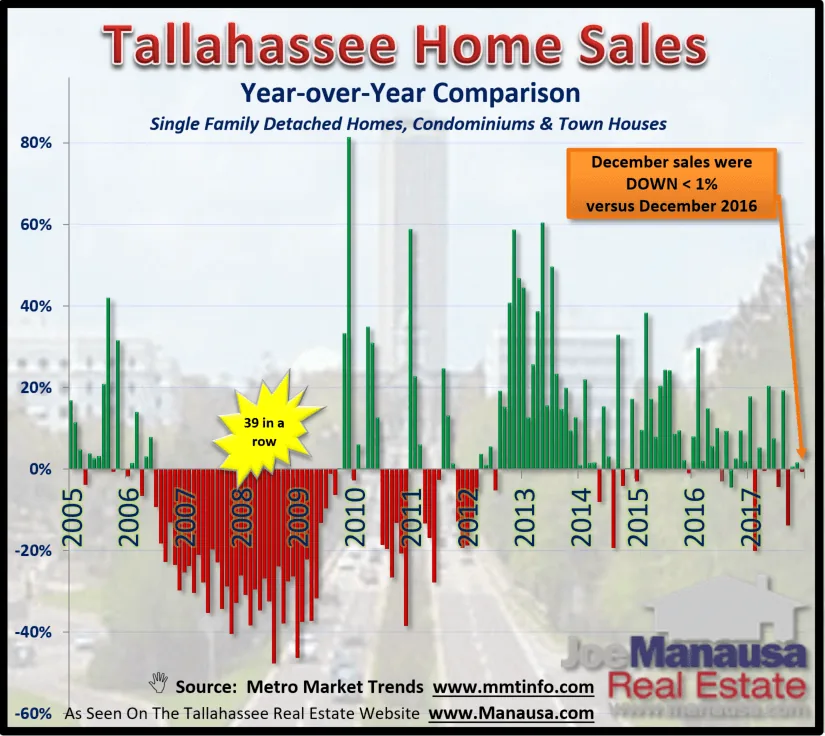
The graph above was assembled with information from all residential sales recorded with the Leon County Property Appraiser’s office, meaning it includes sales that are not part of the Realtor’s MLS and thus is more comprehensive than our normal MLS reports.
Year over year home sales compares each month’s home sales with the same month from the prior year. Green lines indicate growth, while red lines show declines.
December was only the 10th declining month since the end of 2012 when the market began improving from the housing market collapse of 2006.
For the year, home sales grew 3.2% from 5,172 residential units sold in 2016 to 5,336 sold in 2017.
Expect Growth To Continue While the rate of the recovery has been slowed by declining inventory, demand remains strong.
The number of homes sold last year was fewer than those sold in all but one year from 1999 through 2007, and we expect our growing population to return to historic norms in terms of per capita home sales. Keep an eye on new construction to combat the declining inventory and rising demand.
The original one-page Weekly Special PDF is still available.
Get the Weekly Special Every Monday
Each Monday morning the Weekly Special takes one Tallahassee housing question, answers it with a chart of local sales, and explains what it means for your next move.
It is free, and you can unsubscribe any time.