
Weekly Special | March 12, 2017
How 2017 Home Sales Stack Up Thus Far
Home sales are down nearly three percent through February when compared to the same period last year.
The lack of available inventory in some areas and many price ranges is failing demand from a growing buyer pool.
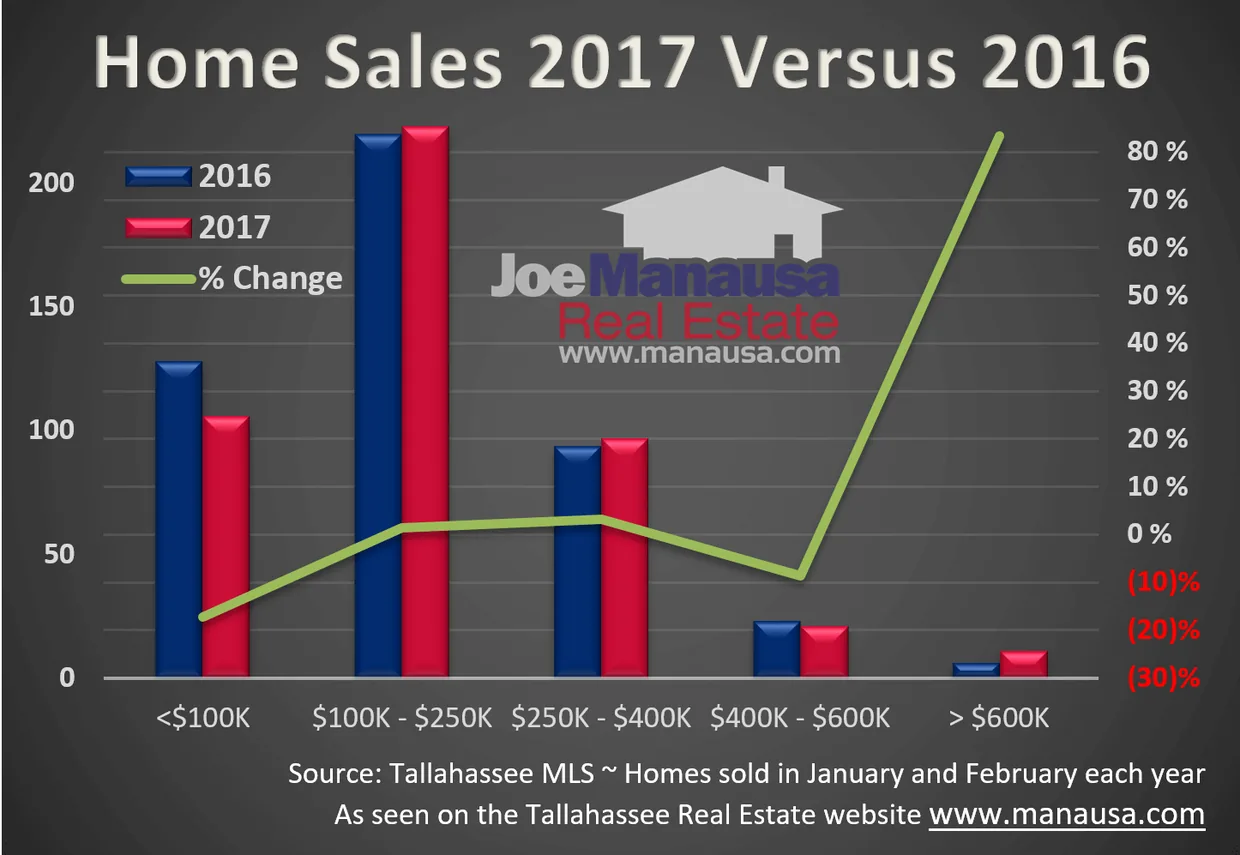
In the graph above, we’ve broken the market down into five price ranges and have combined all single family detached home sales with condo and townhouse sales. Here’s what it shows.
• The low end is down 17% • The middle is up 1% • The high end is up 83% It’s far too early to suggest that any of this is truly trend-worthy, and the seasonal low number of sales means we could get some extreme percentage variations right now. In fact, we’re only talking 13 home sales fewer this year than there were last year.
But I think two key trends here will bear out all year long.
1) Low end inventory is going to remain scarce (it’s not like we can build more $75K homes. We’ll see the non-student low end market (NW) start to move back into areas that have recently been dominated by students.
2) High end inventory remains very high, but motivated sellers will move. The high end market is on fire, and the threat of rising interest rates looms. I’m concerned that the high end market will all but shut down if rates shoot up by more than a percent this year or next.
If you have a home that you might consider selling, now is a very good time to talk to a market expert for your area and get a current valuation.
This issue went with a longer report on our blog: read the full blog post. The original one-page Weekly Special PDF is still available.
Get the Weekly Special Every Monday
Each Monday morning the Weekly Special takes one Tallahassee housing question, answers it with a chart of local sales, and explains what it means for your next move.
It is free, and you can unsubscribe any time.