
Weekly Special | May 3, 2021
Twenty Year Comparison Of Home Prices
The past twenty years has brought about significant changes in what buyers have been spending on homes in Tallahassee.
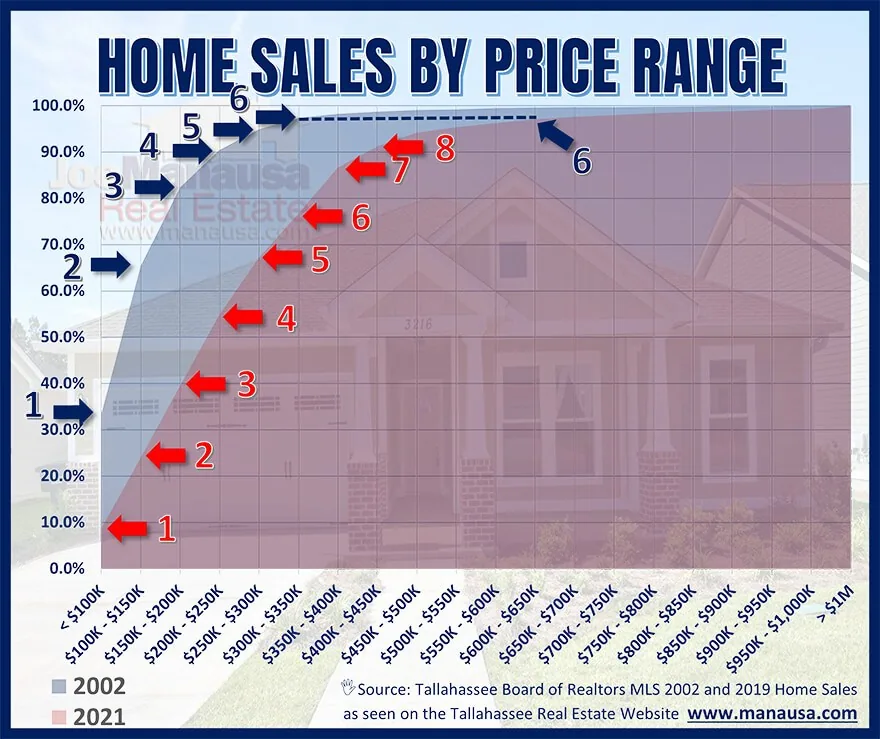
This graph shows the distribution of home sales across each price range, with the blue-shaded area showing prices in 2002 and the red-shaded area showing prices in 2021. The numbers with arrows show how the two years compare:
1. In 2002, one-third of all homes sold went at prices below $100K, but in 2021, only 8% of sales hit that mark.
2. In 2002, two-thirds of all homes sold went at prices below $150K compared with just 25% of sales this year.
6. 95% of all homes sold in 2002 were priced below $350K whereas the 95% marker in 2021 points at $600K.
If we had a crystal ball and could look at home prices 20 years in the future, we’re going to see the growth far greater than what we see here.
The rising cost of materials and land coupled with a much faster growth of the minimum wage in the near future means that homes will get pricier, faster. This will have reduce demand as many “move-up” buyers won’t be able to do so.
The original one-page Weekly Special PDF is still available.
Get the Weekly Special Every Monday
Each Monday morning the Weekly Special takes one Tallahassee housing question, answers it with a chart of local sales, and explains what it means for your next move.
It is free, and you can unsubscribe any time.