
Weekly Special | September 23, 2024
Slow Home Sales Defy Seasonal Trends
Year-over-year home sales fell 11% in August, continuing the home affordability cooldown that began more than two years ago.
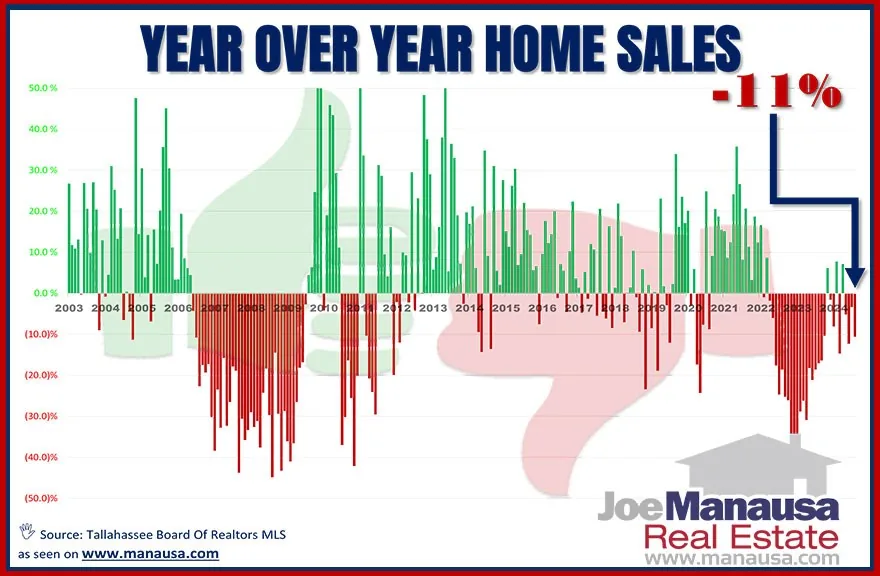
This graph is a great tool to evaluate non-seasonal fluctuations in the housing market. Each vertical bar reflects the percentage change in the number of homes sold each month when compared to the same month the year prior.
With four consecutive monthly declines concluding in August, those of us in the real estate, mortgage, title, and supporting industries continue to see the market move toward neutral with the relative supply of homes for sale growing slowly.
The primary reasons for slow sales include the low inventory levels, elevated home prices, and mortgage shock. Homeowners feel stuck in their current homes because their mortgage rates are half of today’s rates. Ironically, today’s rates are great, well below the 50-year average, they just are much higher than the historically low rates of the past five years.
Throw Out Seasonality Many newcomers to real estate are concerned about low August home sales, but as of now, the 296 sales this August are 80% higher than the 164 recorded in 2010, though 21% lower than the average August since 2002.
After experiencing the market correction 15 years ago, I’ve noticed that slow years often disregard typical seasonal trends.
In strong markets, August closings are robust, but during periods like today, when discretionary buyers are absent, sales remain steady without the usual summer spikes.
The original one-page Weekly Special PDF is still available.
Get the Weekly Special Every Monday
Each Monday morning the Weekly Special takes one Tallahassee housing question, answers it with a chart of local sales, and explains what it means for your next move.
It is free, and you can unsubscribe any time.