
Weekly Special | May 6, 2018
How Does Today’s Market Compare With The Past?
As the housing market continues to improve, it would be prudent to compare today’s sales and home prices to those of the past.
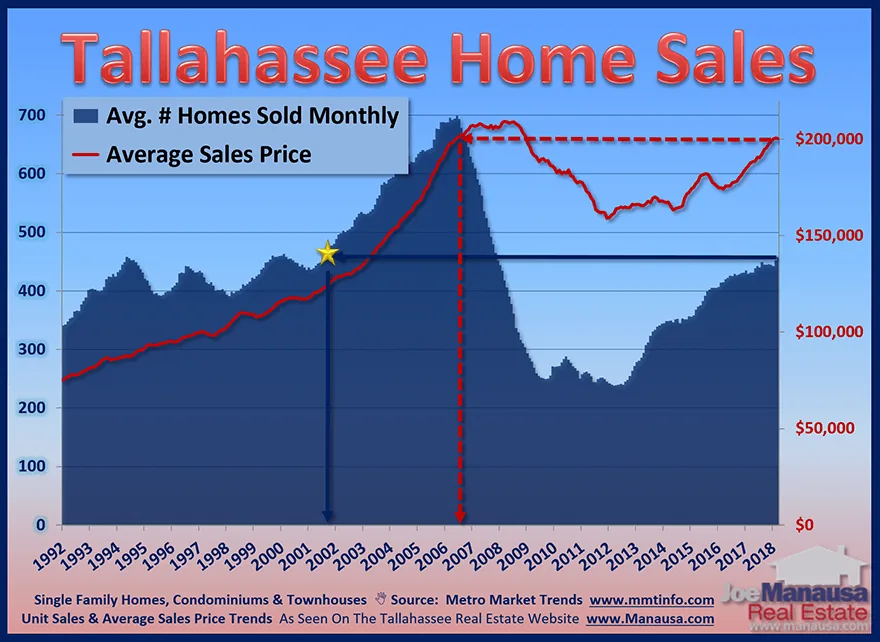
When the housing market collapsed in 2006, it should not have been a surprise had we been paying closer attention. There are numerous statistics and trends that we can monitor to see “the next one” coming.
Two great statistics to continuously track are affordability and activity.
In the graph above, we measure the one-year trend of monthly home sales (blue bars) and the one-year trend of average home prices. Here’s what I see:
Activity – The number of homes selling right now is equivalent to the numbers record ed i n 2 0 01 a nd 1 99 9 .
Considering there are over 20% more people living in Tallahassee today than there were during those dates, I suspect there is significant upside remaining in the housing market recovery.
Affordability – The average price of a home in Tallahassee is near the all time high, though just below it.
Of course, minimum wage is up roughly 50% since 2005, so it means the COST to produce new homes is likely to be 50% higher as well.
I do not believe that rising prices is a concern for the current time, especially with mortgage interest rates at 1/2 of their 50 year average (meaning buyers are spending far less money on interest with their monthly payments and more towards the purchase of the home).
The original one-page Weekly Special PDF is still available.
Get the Weekly Special Every Monday
Each Monday morning the Weekly Special takes one Tallahassee housing question, answers it with a chart of local sales, and explains what it means for your next move.
It is free, and you can unsubscribe any time.