
Weekly Special | August 8, 2022
“No Bueno” For Top End Of Home Prices
Perhaps the most sought-after statistic in real estate is the median home price (and how it has changed over time) because it gives us a simple understanding of home price movement.
The median price is the middle point for home prices. It is not the same as the average price. The median price is the price in the very middle of a data set, with exactly half of the houses priced for less and half priced for more.
The middle of the market is the least skewed by outlier sales (for example, one year Golden Eagle’s average price was skewed 30+% higher due to a very large home sale that went for millions more than any other home). Tracking the changes in the middle is a simple way to understand real estate market trends.
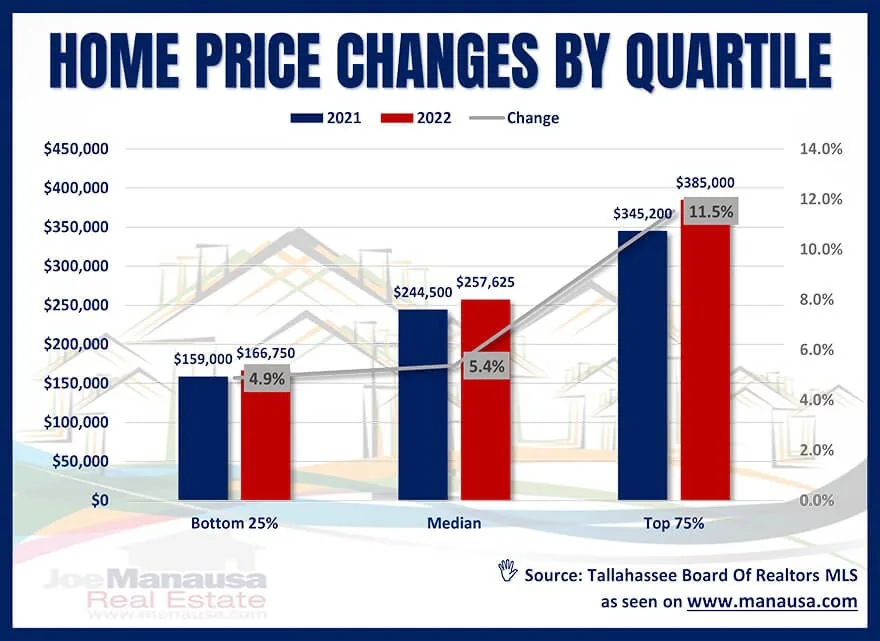
The Middle Of Each Middle We can get a similar but extended view of home prices by doing a quartile analysis. Unlike the median that finds the middle home sale among all sales, a quartile are the prices sitting at 25%, 50%, and 75% within the data set. The second quartiles (50%) is the median.
The graph above shows that prices are changing at the top faster than they are at the bottom. The lowest quartiles has moved 4.9% higher through 7 months of 2022, while the median is up 5.4% and the top quartile is up 11.5% at the same point in time.
All quartiles are moving at unhealthy rates, but the top quartile is on track to come very close to a 20%+ gain for the 2022 calendar year. This is no bueno!
The original one-page Weekly Special PDF is still available.
Get the Weekly Special Every Monday
Each Monday morning the Weekly Special takes one Tallahassee housing question, answers it with a chart of local sales, and explains what it means for your next move.
It is free, and you can unsubscribe any time.