
Weekly Special | May 2, 2022
Home Affordability Crisis To Get Worse
The graph in today’s report plots home affordability in Tallahassee with an adjustment for inflation. We adjust for inflation to uncover the real growth or decline in home affordability by comparing all years in constant money terms. In our case, we are adjusting all prices to 1991 dollars.
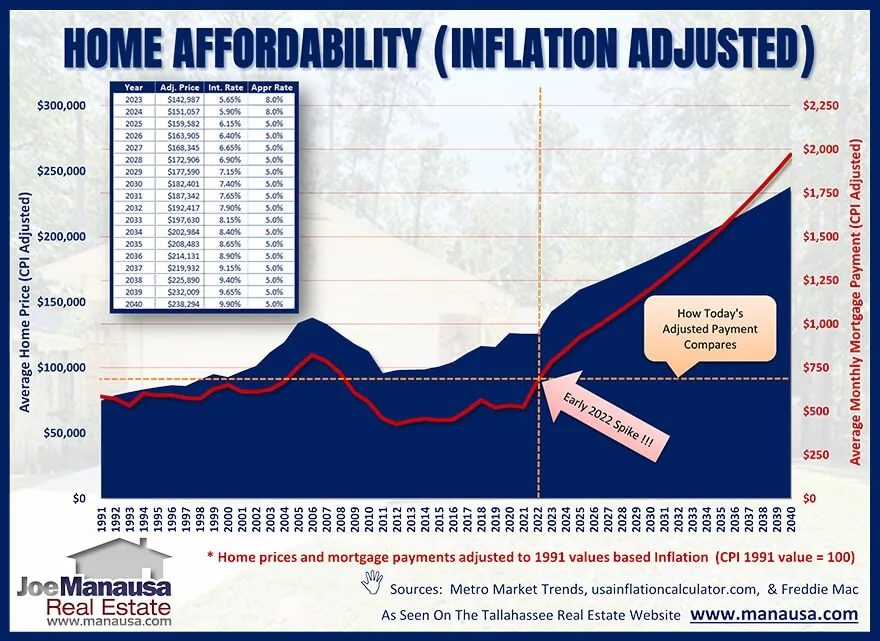
The blue bars plot the average home price (adjusted to 1991 dollars) and are measured on the left vertical axis, while the red line plots the average monthly mortgage principal and interest payment (measured on the right vertical axis). Note that the horizontal axis runs from 1991 through 2040, allowing me to use current information and a few conservative assumptions to forecast a dark future for home affordability.
The crossed dashed-line shows where we are today, note how the red line (home affordability) has surged at its fastest rate ever to start this year. The horizontal dashed line shows how today’s adjusted mortgage payment is now higher (less affordable) than all previous years with the exception of 2004 through 2008. Yet look how I project home affordability moving forward!
Remember, all values in this graph are adjusted to 1991 dollars, so a buyer today is getting a better buy than a buyer in 2005, but worse than any buyer from the 1990s. Unfortunately, I project monthly mortgage payments will reach a new all-time high before the end of 2023 (and home affordability will continue to erode from there). Buyers are running out of town to get a relatively affordable home in Tallahassee.
The original one-page Weekly Special PDF is still available.
Get the Weekly Special Every Monday
Each Monday morning the Weekly Special takes one Tallahassee housing question, answers it with a chart of local sales, and explains what it means for your next move.
It is free, and you can unsubscribe any time.