
Weekly Special | May 11, 2020
Why Tallahassee Home Prices Are Soaring
Simple supply and demand analysis teaches us that when demand outraces supply, prices go up. That is what has been occurring in Tallahassee for a few years now.
Low mortgage interest rates coupled with a strong economy has helped the housing market grow each year since the bottom back in 2012.
Homes are not selling at levels seen back in 2004 through 2006, but they have returned to a healthy and sustainable level. Demand is good.
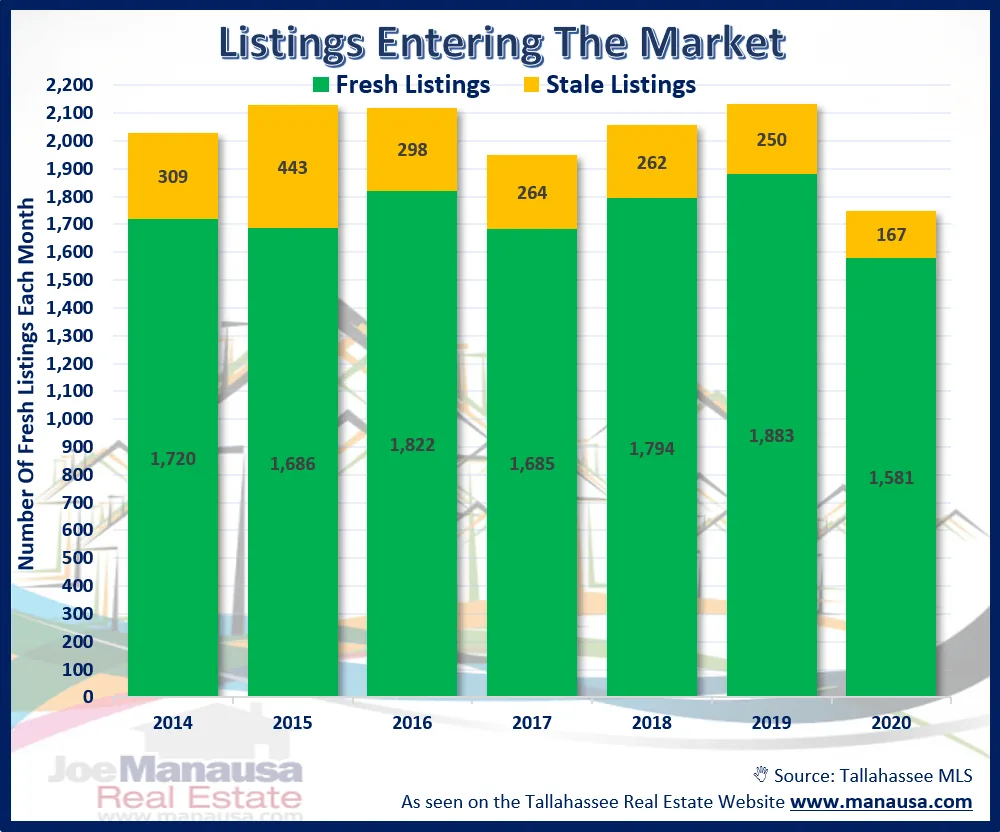
The graph above shows the number of homes entering the market from January through April of each year.
“Fresh” listings are those that have not been recently listed for sale, while “Stale” ones are properties that recently failed to sell and are now listed with a new broker.
The amount of stale listings (prior to this graph data) was overwhelming for nearly 10 years after the housing market crash, now they’re only 10% of the listings.
Fresh listings are down 16% since last year, but demand has declined 3%. This means we should expect further escalation of home prices and sellers in this market will continue to have their way with buyers.
The original one-page Weekly Special PDF is still available.
Get the Weekly Special Every Monday
Each Monday morning the Weekly Special takes one Tallahassee housing question, answers it with a chart of local sales, and explains what it means for your next move.
It is free, and you can unsubscribe any time.