
Weekly Special | April 19, 2021
Year Over Year Supply Is Troubling
Contrary to demand which is growing, the supply of homes for sale continues to drop. This week’s graph displays the count of year-over-year fresh listings entering the market.
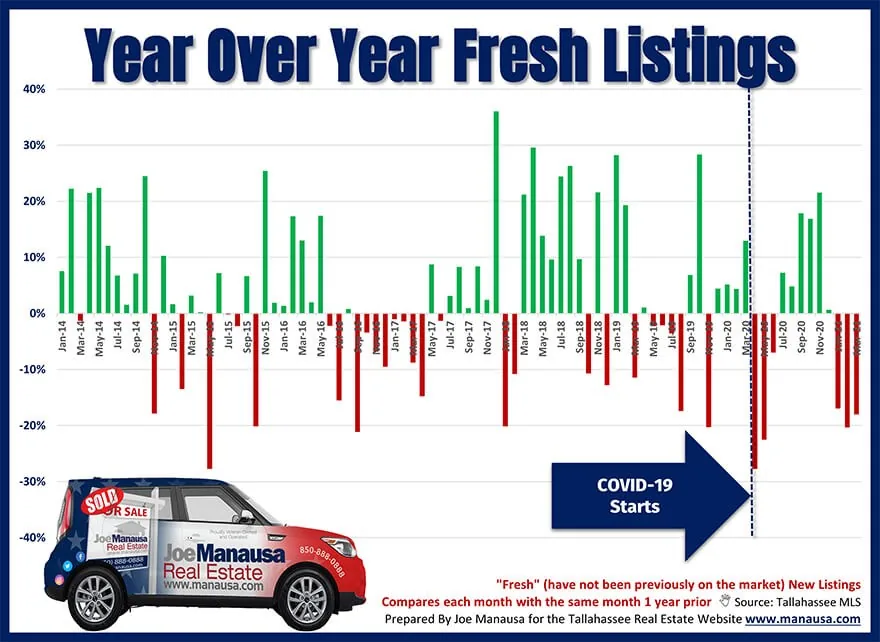
This graph compares each month of the year with the same month from the year prior. We’re looking at the change in fresh new listings entering the market, where “fresh” means we only consider homes that were not previously listed for sale.
For the third consecutive month, fresh listings dropped at an alarming rate. Next month will mark the one-year anniversary of the COVID effect on new listings, so I’m expecting this trend to reverse throughout the second quarter.
In 2021, we have seen the second-fewest fresh listings for the first quarter of each of the past eight years.
Existing homes entering the market are just one home short of being the worst of the past eight years, while new construction listings are ranked as the third-best. With inventory shortages being pronounced and obvious since 2016, it would be nice to see fresh new construction listings ranking as first-best until the housing market stabilizes.
But that is apparently not going to be the case. This means that bidding wars on the relatively few homes for sale will continue to escalate now that we have seen the inventory reduce to a new all-time low. If you want to buy a home, make sure you work with a market-savvy buyer’s agent who can get you the home.
The original one-page Weekly Special PDF is still available.
Get the Weekly Special Every Monday
Each Monday morning the Weekly Special takes one Tallahassee housing question, answers it with a chart of local sales, and explains what it means for your next move.
It is free, and you can unsubscribe any time.