
Weekly Special | November 6, 2023
What’s Really Happening With Foreclosures?
This week’s graph addresses a very hot topic on social media … the crash of the housing market that will result in millions of foreclosed homes.
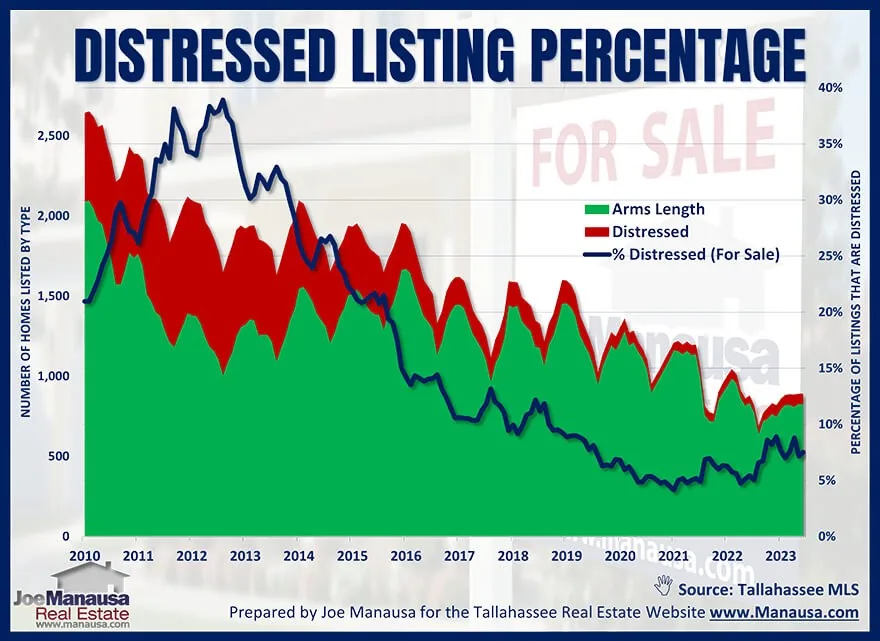
Since so many people are expecting significant price declines that lead to foreclosures (like we saw during the housing bubble 15 years ago), I find it’s healthy to continually evaluate the current status or health of home sellers in the Tallahassee housing market today.
The graph above plots all homes for sale, with the green area measuring the number of arms-length home sellers, while the red area plots the number of distressed home sellers.
The blue line plots the ratio of distressed property listings to all properties listed, and the sharp rise in the distressed ratio that began about a year ago has already cooled, leaving the ratio just slightly above an all-time low.
The sharp increase in the graph was NOT a sharp increase in distressed properties, rather it revealed a greater percentage of listings that were in distress.
With fewer homes on the market from healthy home sellers, the same number of distressed sellers represented a greater percentage. The number of distressed listings today is very similar to the pre-COVID listing count in early 2020. Now that the count of listings has stabilized, we see the percentage is falling back to a level where the market is about as healthy (foreclosure wise) as ever.
The original one-page Weekly Special PDF is still available.
Get the Weekly Special Every Monday
Each Monday morning the Weekly Special takes one Tallahassee housing question, answers it with a chart of local sales, and explains what it means for your next move.
It is free, and you can unsubscribe any time.