
Weekly Special | July 28, 2018
Market Health Report: Patient Is Recovering
One good method of keeping an eye on the health of a local housing market is to track foreclosure filings and home sales over time, and that is what we are sharing today.
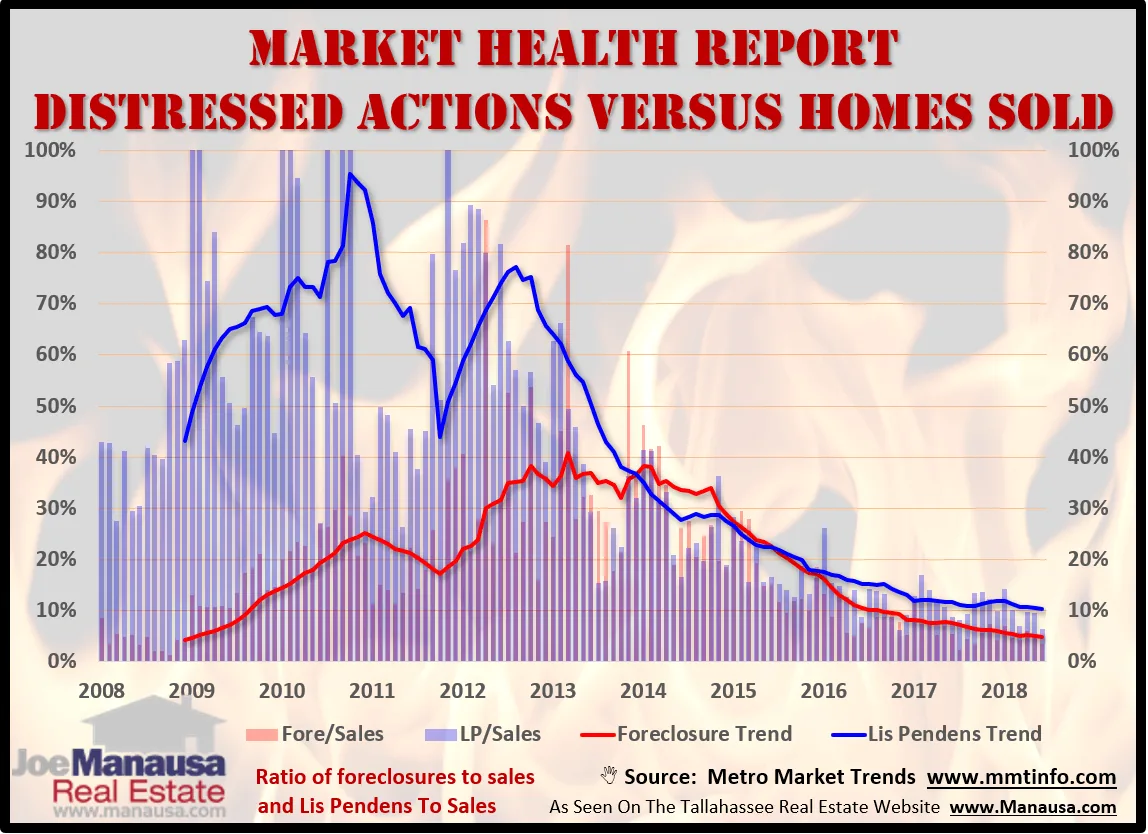
In the graph above, we are tracking lis pendens filings in blue (Lis Pendens are the start of the foreclosure process) and foreclosure sales in red (not all lis pendens make it to a foreclosure sale, which is the final step of the foreclosure process).
The way they have been tracked is by calculating the ratio of each to the number of homes sold each month. Thus, the blue bars measure the ratio of lis pendens filed to homes sold while the red bars measure the ratio of foreclosure sales to all home sales each month.
The blue and red lines represent the one year average of each measurement.
Healthier Housing Market What these two trends clearly show us is a Tallahassee housing market that continues to get healthier.
In 2010, there was a point where every 100 homes sold had a simultaneous 95 lis pendens filed. Now, we are seeing that number reduced to below 10.
In 2013, there was a point when 40% of all homes sold over the previous 12 months were foreclosures. Today, foreclosure sales only account for just 5% of all homes sold over the past year.
While these trends need to continue improving, the market is far healthier than it’s been over the past 12+ years.
The original one-page Weekly Special PDF is still available.
Get the Weekly Special Every Monday
Each Monday morning the Weekly Special takes one Tallahassee housing question, answers it with a chart of local sales, and explains what it means for your next move.
It is free, and you can unsubscribe any time.