
Weekly Special | November 30, 2020
Existing Home Values Approach New High
It took more than 13 years, but the average existing home value is finally approaching the high point achieved in June 2007.
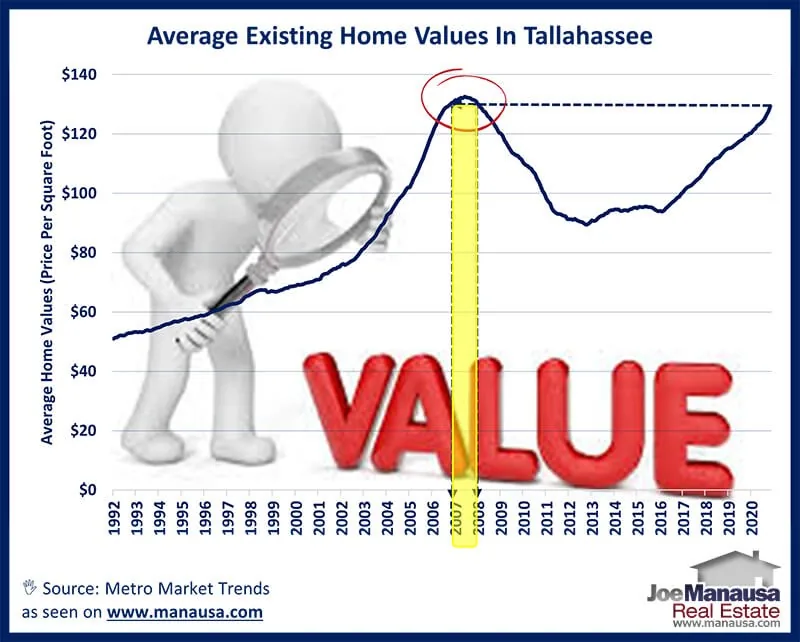
Based upon the current strong demand, buoyed by historic-low mortgage interest rates, and coupled with the extremely low supply of homes, I suspect we’ll be seeing that all-time high average existing home value before Spring is upon us.
The graph above plots the twelve-month trend of the average price per square foot of homes sold in Tallahassee. By plotting the twelve-month average, we remove all seasonality and see the true direction of the housing market.
Also, by focusing purely on existing home sales, we don’t see the wild fluctuations that can be caused by a bunch of new construction sales.
The yellow slivers in the graph shows that only 2007 home values were higher than our current level, and that was the peak of market 13 years ago.
It won’t be long until we soar above this level. The minimum wage will be rising 93% over the next five years, so barring a market collapse, values will go higher, faster than ever.
The original one-page Weekly Special PDF is still available.
Get the Weekly Special Every Monday
Each Monday morning the Weekly Special takes one Tallahassee housing question, answers it with a chart of local sales, and explains what it means for your next move.
It is free, and you can unsubscribe any time.