
Weekly Special | September 2, 2017
Can You Spot The Likeliest “Deal” In Tallahassee?
When we track average home prices in Tallahassee over time, an interesting dynamic becomes evident.
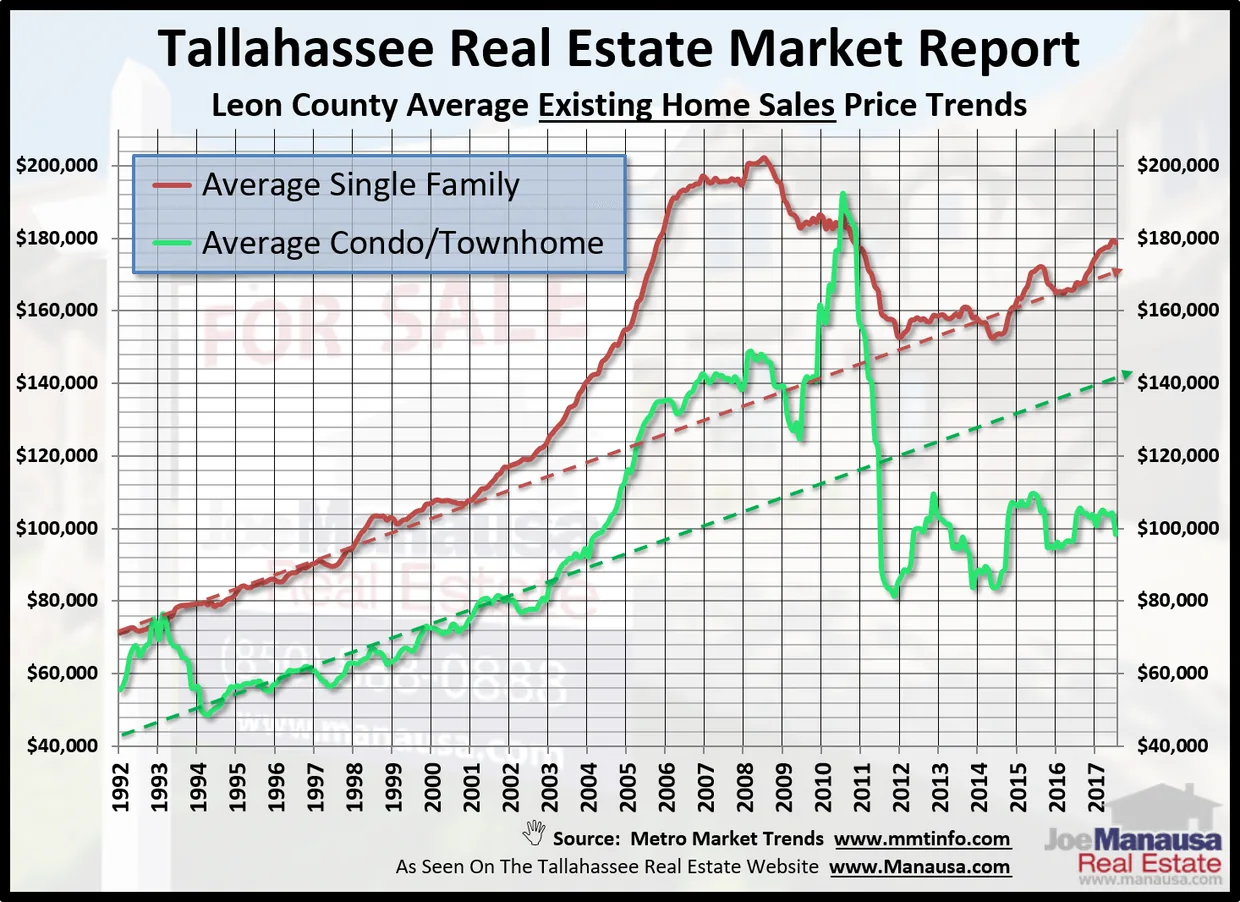
In the graph above, we are looking at average EXISTING home prices (meaning we have excluded new construction) since 1991, in two groups.
The red line shows the one-year average of single family detached existing home prices, while the green line measures the one-year average of existing condominium/townhome prices.
The dotted line is merely an estimate of where prices “should” be if prices over time moved up on a consistent trend with how prices grew in the 1990s.
What stands out to me immediately is that condominiums and townhouses, on average, are still quite a bargain.
Single family detached home prices are now in line with what we might have projected 20 years ago, but right now buyers appear to be able to get “40% off” on “attached” property.
Of course, this does not mean that every condominium unit is 40% off, nor does it mean you can haphazardly buy a townhouse or two without conducting serious research on prices & values.
Advice On Buying A Home Today If you are planning on buying a home soon and think you’ll be moving again within the next three to five years, make sure you include attached homes when you shop, as they are very likely to out-perform detached homes in appreciation during that period of time.
This issue went with a longer report on our blog: read the full blog post. The original one-page Weekly Special PDF is still available.
Get the Weekly Special Every Monday
Each Monday morning the Weekly Special takes one Tallahassee housing question, answers it with a chart of local sales, and explains what it means for your next move.
It is free, and you can unsubscribe any time.