

Weekly Special | June 29, 2020
Average Home Price & Payment Since 1991
Average home prices keep pushing higher in Tallahassee, so I thought it would be interesting to plot the average home price against the average mortgage payment since I first began selling homes in 1991.
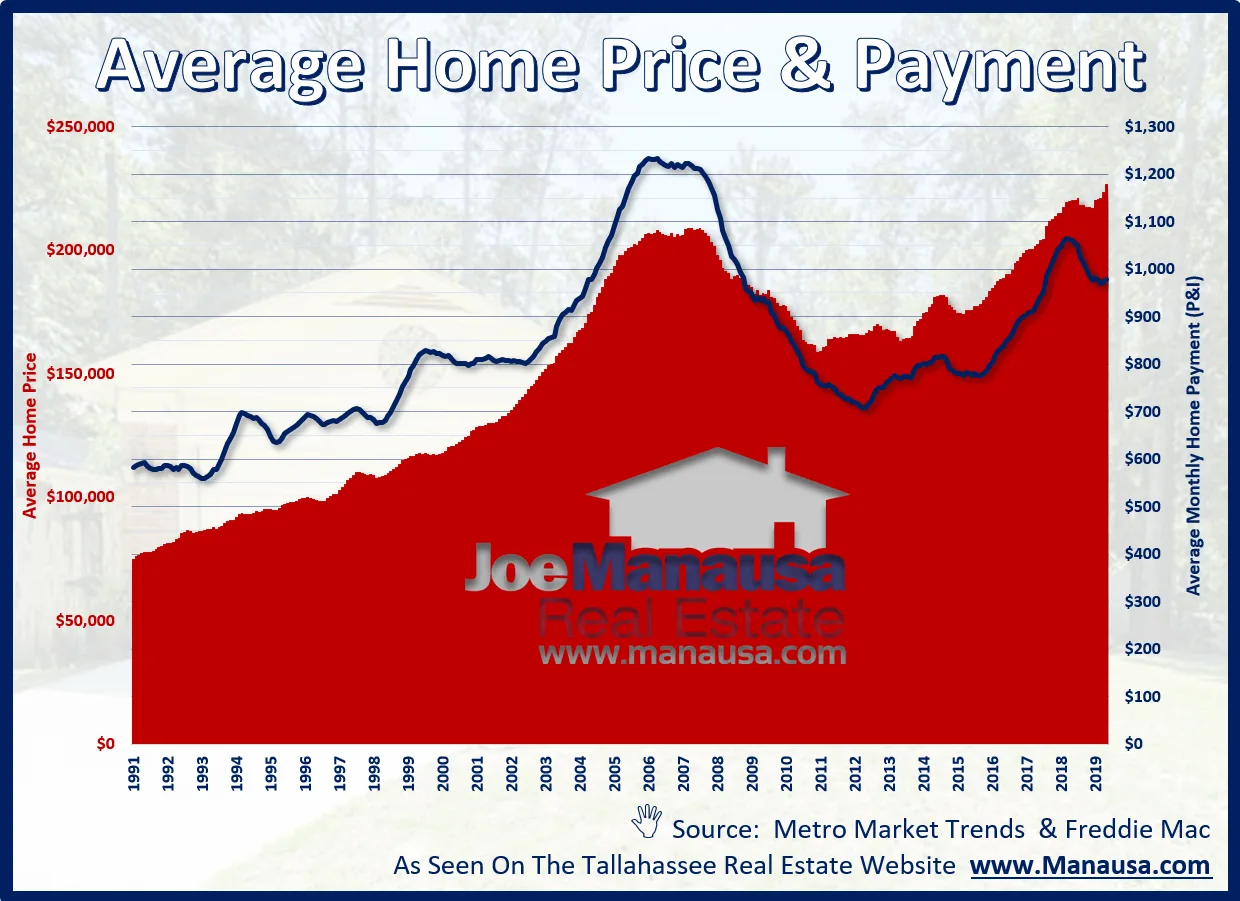
In the graph above, the red area reports the average home price each month (measured on the left vertical axis) while the blue line measures the average mortgage payment for somebody purchasing the home in the same month. The payment was calculated using the (then) current mortgage interested rate while financing 95% of the home.
The first observation that I make when looking at the graph is that the average home price has moved higher at a faster rate than have the monthly payments. Of course, knowing that mortgage interest rates have fallen significantly during that time span does not make this a big surprise, but it is still nice to see.
I started selling homes in September of 1991, and since that time, here’s the total change:
The average home price went from $78K to $227K (+3.75% annually)
while the monthly payment went from $578 to $977 (+1.84% annually).
Considering that neither of these are adjusted for inflation (wages are higher today than they were 30 years ago, perhaps a future report can show these with adjustments (if you would like this let me know).
The original one-page Weekly Special PDF is still available.
Get the Weekly Special Every Monday
Each Monday morning the Weekly Special takes one Tallahassee housing question, answers it with a chart of local sales, and explains what it means for your next move.
It is free, and you can unsubscribe any time.