
Weekly Special | March 4, 2018
Here’s What Buyers Are Paying For Homes
If you are curious about the amount of money buyers are paying for homes in Tallahassee, then you’ll like the graph in today’s Weekly Special.
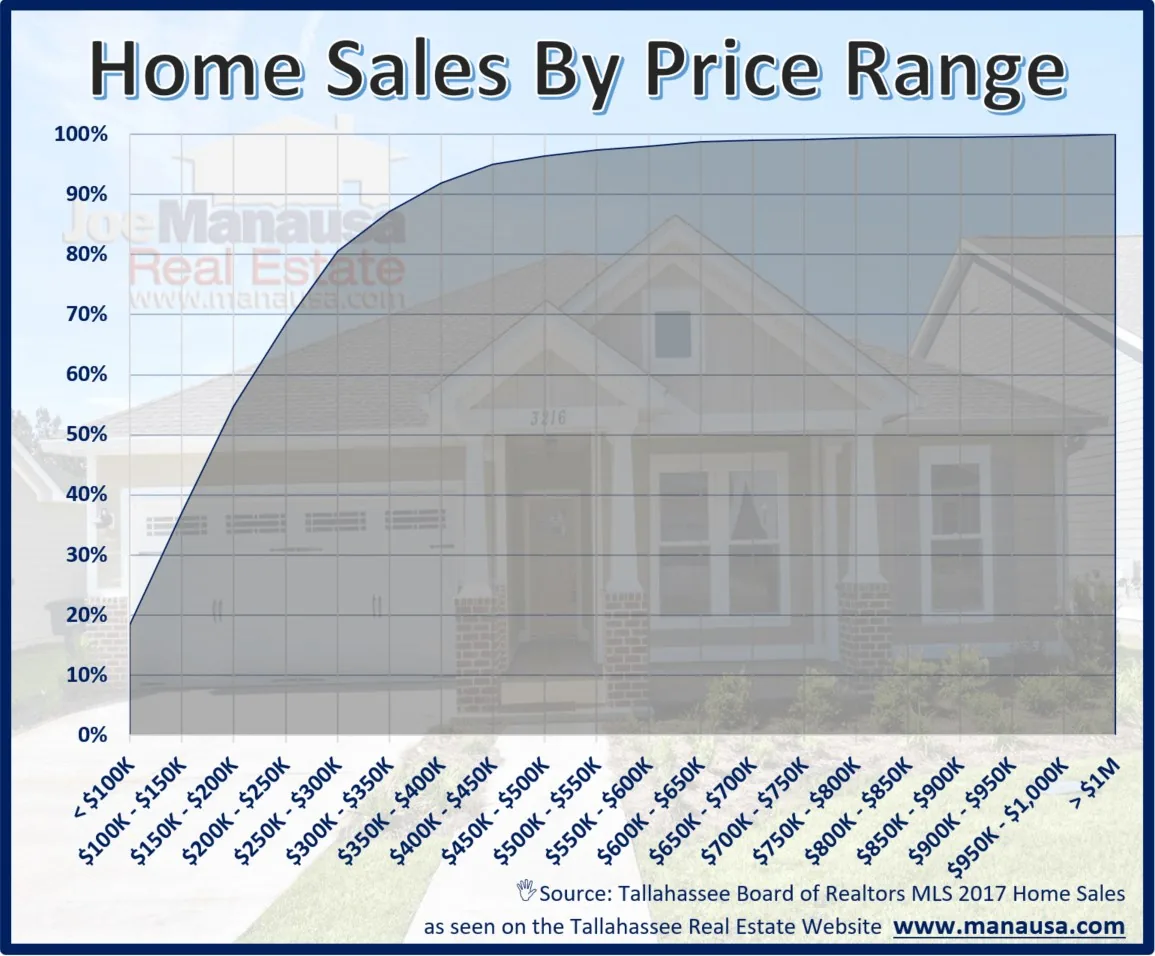
We have plotted all homes sold in 2017 as a percentage of all homes sold. This graph runs cumulatively and the percentage for each price range is shown on the left vertical axis.
Here’s a few observations:
• 18% of all homes sold were under $100K • 1/5th of 1% of all homes sold were over $1M • Less than 1% of all homes sold were over $650K • The median home price was $185K ($175K resales & $@285K new)
• 80% of all homes sold were under $300K Best Use Of Real Estate Reports If you are in the market to sell a home or buy a home in Tallahassee, it is easy to misinterpret the plethora of automated charts and graphs that are available on most real estate websites.
Recognize that “averages” can be misleading and location really does matter (so don’t use a market average to determine a specific home’s value).
If you have any questions about the Tallahassee market, just give us a call!
The original one-page Weekly Special PDF is still available.
Get the Weekly Special Every Monday
Each Monday morning the Weekly Special takes one Tallahassee housing question, answers it with a chart of local sales, and explains what it means for your next move.
It is free, and you can unsubscribe any time.