
Weekly Special | September 15, 2025
The Supply And Demand Picture For Housing
In real estate, price changes follow math, not magic. The numbers in the table above reveal exactly where Tallahassee’s housing market tilts toward buyers, sellers, or balance.
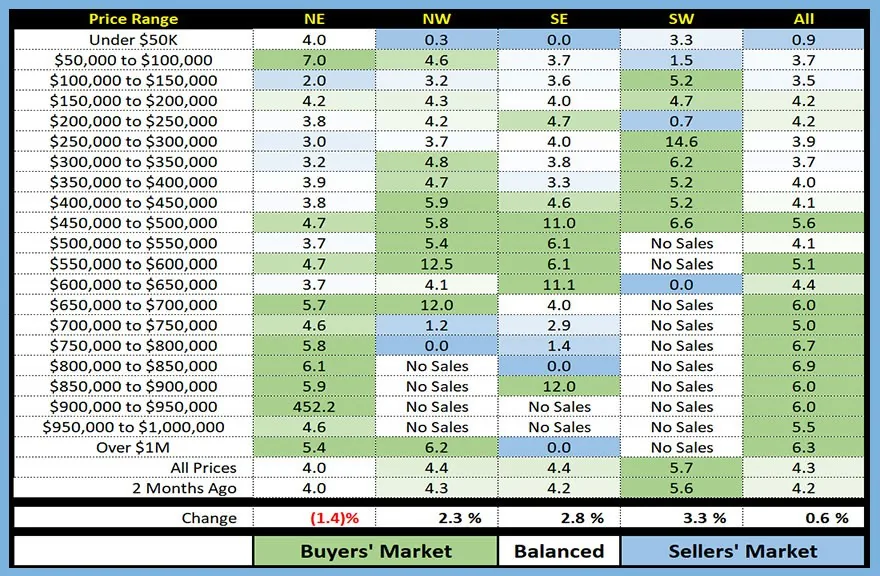
In the table above, I plot the supply and demand for each quadrant of Leon County, broken down by price range.
When you see a box with no highlight color, that means the market is balanced for that specific set of homes. When we see shades of green, the market favors buyers, whereas blue areas designate sellers’ market conditions.
Here’s how it works:
A balanced market (white box) means there are enough homes to meet current demand.
A buyer’s market (green) means more homes are available than buyers. Expect slower sales and softer prices.
A seller’s market (blue) means demand exceeds supply. That’s when multiple offers, quick sales, and rising prices occur.
Notice how these conditions shift across neighborhoods and price ranges. For example, homes between $200K– $250K show the NE, NW and overall is fairly balanced, while the SE favors buyers and the SW favors sellers.
The takeaway is measurable: supply vs. demand is the lever that moves values. Ignore the headlines, the numbers are the truth.
Want to see the exact supply-demand ratio for your home’s price point and zip code? Call me today, and I’ll send you a custom snapshot.
The original one-page Weekly Special PDF is still available.
Get the Weekly Special Every Monday
Each Monday morning the Weekly Special takes one Tallahassee housing question, answers it with a chart of local sales, and explains what it means for your next move.
It is free, and you can unsubscribe any time.