
Weekly Special | September 18, 2023
Year-To-Date Home Sales Fall
Year-to-date home sale are down 25% through August compared to sales through August last year.
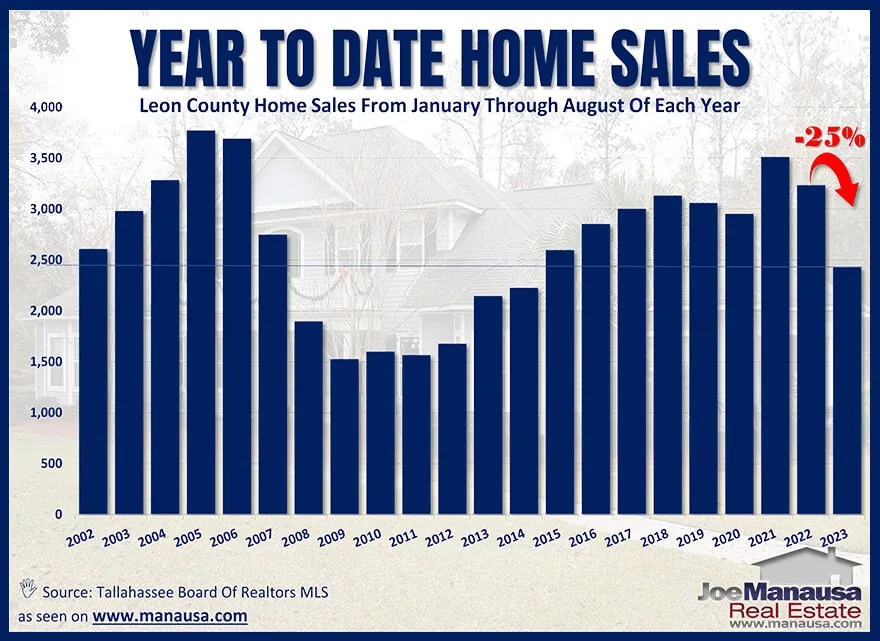
The graph above plots home sales from January through August for each of the past 22 years, and we see that 2023 remains stronger than 7 of those years.
Since the recent peak of the market in 2021, the number of homes selling each month has dropped 31%.
The combination of soaring home prices and rapidly elevated mortgage interest rates means home affordability has fallen like an anchor in deep water.
How Low Can It Go?
Tallahassee is facing a unique situation: while the local economy is thriving, demand for homes is decreasing. The declining demand is a bit of a misnomer.
The demand for affordable homes is high while the prices of existing homes are far above the affordable level for much of our local population.
Currently, there are a lot of apartment units under construction that hope to fill the demand for “somewhat affordable” homes.
The for-sale market is further complicated by the fact that many homeowners are effectively “locked in” to their current homes. This is due to a sharp increase in mortgage interest rates two years ago where.
Many of these homeowners secured mortgages at rates that are significantly lower than today’s rates. As a result, even if they were to downsize, they would likely face higher monthly housing costs.
The original one-page Weekly Special PDF is still available.
Get the Weekly Special Every Monday
Each Monday morning the Weekly Special takes one Tallahassee housing question, answers it with a chart of local sales, and explains what it means for your next move.
It is free, and you can unsubscribe any time.