
Weekly Special | May 17, 2021
How Buyers Are Paying For Their Homes
One question I get when the real estate market heats up (like it is today) is “where is everybody getting all the money to buy new homes?”
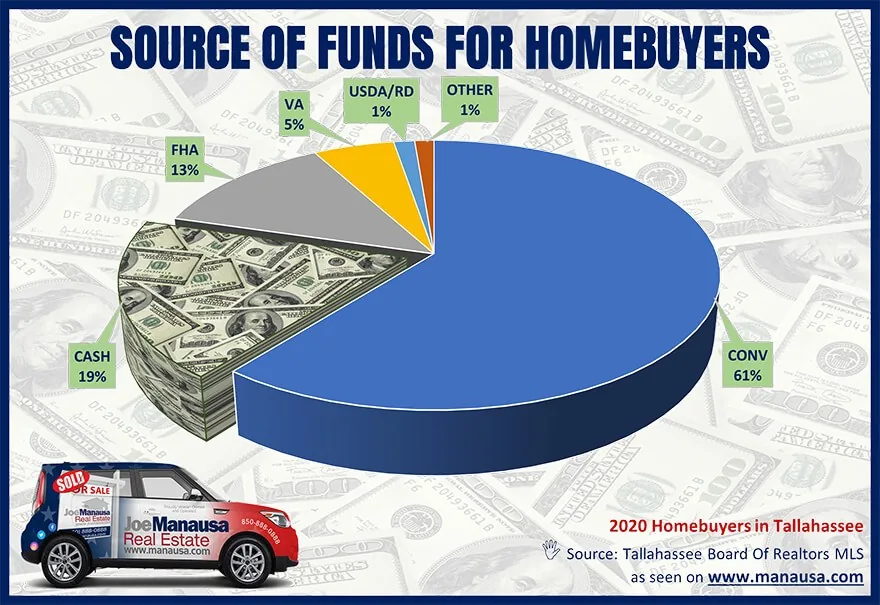
Well, I figured I would try to be proactive and spread the word before I’m asked this year. I can tell you that it’s the same usual suspects, though the percentages have changed a little.
In 2020, 80% of buyers either get a conventional loan product or they paid cash, with the final 20% coming from FHA, VA, USDA/RD, or “Other.”
Perhaps the biggest mover on last year’s graph were the cash buyers. We typically see cash buyers make up about 23% of the market, but the fact that mortgage interest rates were so low, we’re found more buyers overall.
The number of cash buyers was about the same number as usual, but since more people were being drawn to the market to buy a home with borrowed money, the overall market of buyers was larger so the percentage using cash fell.
The graph above is for the full calendar year in 2020, but look at January through April of each year below to see how the “cash trend” has moved over the years.
The original one-page Weekly Special PDF is still available.
Get the Weekly Special Every Monday
Each Monday morning the Weekly Special takes one Tallahassee housing question, answers it with a chart of local sales, and explains what it means for your next move.
It is free, and you can unsubscribe any time.