
Weekly Special | June 24, 2024
The Home Affordability Crisis Picture
What if there was a single picture that could quantify today’s home affordability crisis? Something you could look at and instantly think … “I get it, that’s where we stand today.”
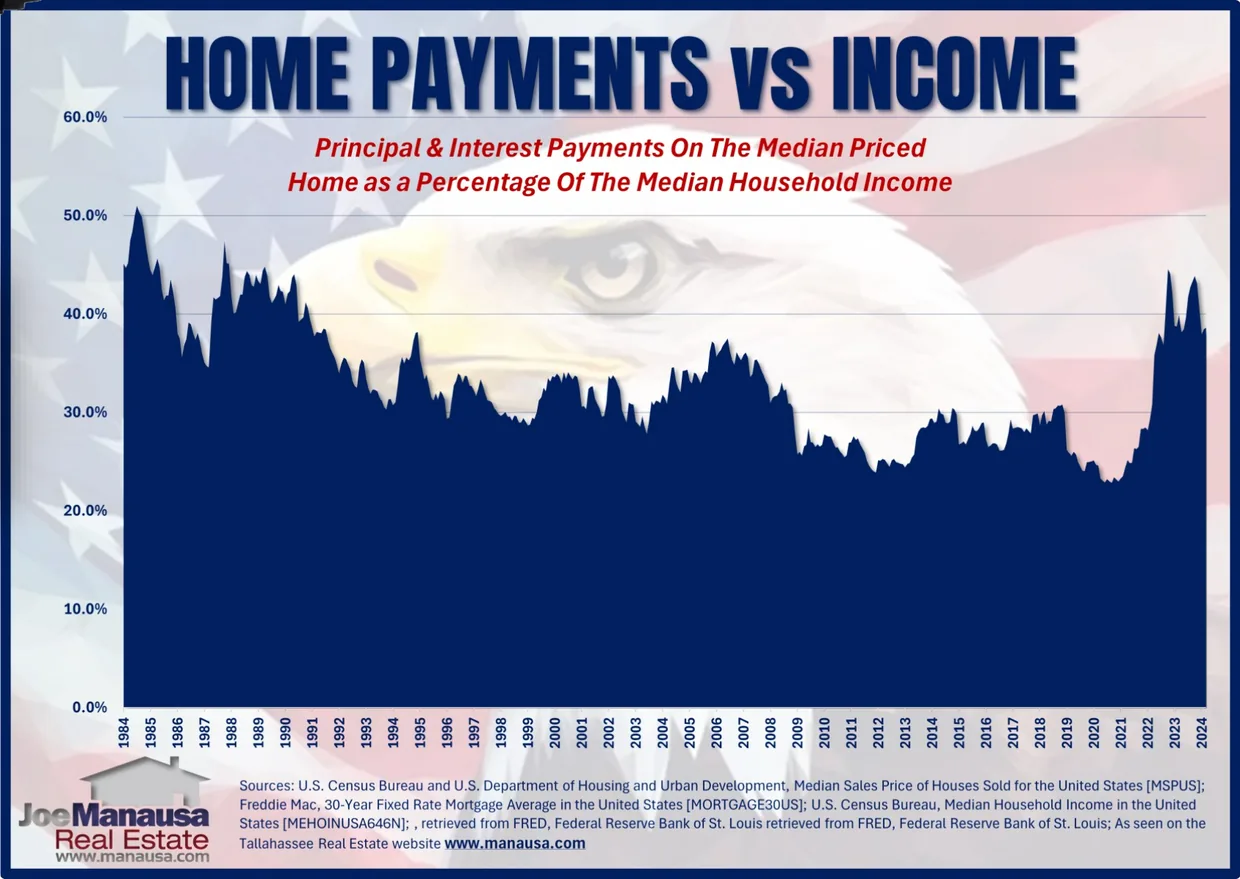
Well, today’s graph is that one picture. I combined a bunch of data to show the percentage of the median household income that has been required to cover the monthly payment on the median home in the US, over time.
Understanding the historical context is crucial to grasp the current state of home affordability. In the 1980s, high mortgage rates combined with relatively lower home prices made homeownership challenging despite lower nominal home costs.
The subsequent decades saw significant economic changes, including deregulation, technological advancements, and shifts in labor markets, influencing both household incomes and home prices.
Government policies have significantly shaped the housing market. For instance, the Federal Reserve’s policies on interest rates directly affect mortgage rates. The low-interest-rate environment post-2008 aimed at stimulating the economy contributed to rising demand and increasing home prices by making borrowing cheaper. The historically low rates during the pandemic created a rush on housing, pushing home prices up by double-digit percentages for nearly three years.
The video on the left explores this crisis in greater detail, showing why we should expect worsening conditions unless we build more homes (fast).
The original one-page Weekly Special PDF is still available.
Get the Weekly Special Every Monday
Each Monday morning the Weekly Special takes one Tallahassee housing question, answers it with a chart of local sales, and explains what it means for your next move.
It is free, and you can unsubscribe any time.