
$115,000
Bond · Southwest Tallahassee
Bond Homes for Sale
Last updated: November 12, 2026
Bond is a neighborhood of 109 single-family homes in Southwest Tallahassee. Homes here were built from 1920 through 2022.
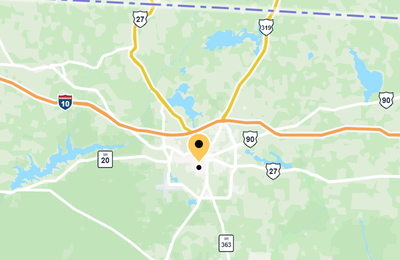
Bond market intelligence
1
This count comes from our last check of the multiple listing service (MLS).
Bond Homes for Sale
At a glance
Bond Key Facts
- Location: Southwest Tallahassee
- ZIP Code: 32310
- Homes: 109 single-family homes
- Construction Era: From 1920 through 2022; median year built 1958
- Median home size: 1,120 square feet
- Most common layout: 3 bedrooms, 2 bathrooms
- HOA: No HOA
- Owner-Occupied: 31% owner occupied
- Elementary school: Bond Elementary, 0.5 miles, Florida DOE school grade A (2026), (850) 488-7676
- Middle school: Nims Middle, 1.0 miles, Florida DOE school grade D (2026), (850) 617-6161
- High school: Leon High, 2.6 miles, Florida DOE school grade B (2026), (850) 617-5700
- Median lot size: 0.17 acres
Property and Neighborhood Explorer
Bond Boundary and Lots
The map below outlines the Bond boundary and every lot inside it. A click on any lot shows its last sale, and the search box finds a home by address.
Zoom in and click any lot for its details.
Loading the Bond property map…
© Mapbox © OpenStreetMap
Neighborhoods Near Bond
- Villa Mitchell, adjoining, 62 homes
- Bond South, adjoining, 118 homes
- Normal School, adjoining, 62 homes
- Victory Sub, 0.1 miles, 7 homes
- Rattler View Condo, 0.3 miles, 14 homes
- Cherry Hill, 0.3 miles, 63 homes
- Elberta Empire, 0.3 miles, 204 homes
- Bloxham Heights, 0.3 miles, 99 homes
- The Lakes, 0.3 miles, 103 homes
- Sunny Hill, 0.3 miles, 41 homes
Every Tallahassee neighborhood we cover is in the neighborhood directory, so you can line Bond up against any of them.
Available now
Bond Homes for Sale
1homes for sale
© 2026 Tallahassee MLS (CATRS). All rights reserved. The data relating to real estate for sale on this web site comes in part from the Internet Data Exchange Program of CATRS. Real estate listings held by IDX Brokerage firms other than Xcellence Realty are marked with the Internet Data Exchange logo or the Internet Data Exchange thumbnail logo and detailed information about them includes the names of the listing brokers. The information being provided is for consumers' personal, non-commercial use and may not be used for any purpose other than to identify prospective properties consumers may be interested in purchasing. Information is deemed reliable but not guaranteed. Data last updated: Friday, November 13th, 2026 at 08:39:56 AM.
Homes and setting
Bond Homes: 109 Single-Family Homes
All 109 homes in Bond are single-family homes, built from 1920 through 2022.
The median home size in Bond is 1,120 square feet of heated and cooled space. The most common layout here is three bedrooms and two bathrooms.
Only 31% of the homes in Bond are owner occupied, meaning the majority are rented or held as a second home.
Bond is in ZIP code 32310. The homes here line Keith Street, Holton Street, Saxon Street, Liberty Street, and Floral Street.
Drive Times From Bond
Downtown & campus
Florida State University
about 6 minutes
1.5 miles
Florida A&M University
about 6 minutes
1.3 miles
Florida Capitol
about 7 minutes
1.8 miles
Bobby Bowden-Tallahassee International Airport
about 11 minutes
4.8 miles
I-10, Exit 199
about 15 minutes
4.8 miles
Hospitals
The coast
Hospitals
Tallahassee Memorial Hospital
about 13 minutes
4.2 miles
HCA Florida Capital Hospital
about 19 minutes
6.6 miles
The coast
Shields Marina, St. Marks
about 32 minutes
20.5 miles
Carrabelle Marina
about 1 hour 10 minutes
54 miles
St. George Island
about 1 hour 40 minutes
75.3 miles
No HOA
Bond has no homeowners association, and there are no association dues.
Bond market
Bond Home Prices and Sales
1Sales closed, past 12 months
109Bond homes
Sales records for Bond begin in 1991 and run through November 12, 2026. The figures below leave out family transfers, bank sales, and short sales.
How Much Do Bond Homes Sell For?
Median price of the homes sold each year in Bond, existing homes and new construction, with 2026 covering January to November
Medians describe the homes that sold each year, not the value of any one home.
A dot on its own marks a year with sales but no sales the year before or after.
Sources: Tallahassee Board of Realtors Multiple Listing Service and the Leon County Property Appraiser. Sales updated November 12, 2026.
New construction and existing homes are always charted separately, so a year's new-construction figure can come from just one or two sales.
Annual figures
| Year | Bond existing homes | Bond new construction | Leon County existing homes | Leon County new construction | Bond sales (existing / new) |
|---|---|---|---|---|---|
| 2026 | $140,000 | $305,000 | $436,000 | 1 / 0 | |
| 2025 | $139,000 | $289,600 | $419,900 | 2 / 0 | |
| 2024 | $167,000 | $288,500 | $416,150 | 3 / 0 | |
| 2023 | $270,000 | $410,700 | 0 / 0 | ||
| 2022 | $68,000 | $208,500 | $245,000 | $415,750 | 3 / 1 |
| 2021 | $91,000 | $225,000 | $325,000 | 4 / 0 | |
| 2020 | $74,500 | $215,000 | $302,150 | 1 / 0 | |
| 2019 | $65,000 | $195,000 | $279,900 | 2 / 0 | |
| 2018 | $53,000 | $188,000 | $310,500 | 1 / 0 | |
| 2017 | $36,750 | $185,000 | $285,400 | 4 / 0 | |
| 2016 | $178,400 | $289,000 | 0 / 0 | ||
| 2015 | $178,000 | $269,850 | 0 / 0 | ||
| 2014 | $176,000 | $276,100 | 0 / 0 | ||
| 2013 | $175,000 | $282,900 | 0 / 0 | ||
| 2012 | $25,000 | $169,000 | $270,900 | 1 / 0 | |
| 2011 | $167,800 | $244,650 | 0 / 0 | ||
| 2010 | $170,000 | $192,000 | 0 / 0 | ||
| 2009 | $168,000 | $184,500 | 0 / 0 | ||
| 2008 | $81,000 | $177,500 | $202,250 | 1 / 0 | |
| 2007 | $120,000 | $133,950 | $179,600 | $193,500 | 4 / 2 |
| 2006 | $127,000 | $176,500 | $183,500 | 1 / 0 | |
| 2005 | $75,500 | $166,050 | 3 / 0 | ||
| 2004 | $88,000 | $149,000 | 3 / 0 | ||
| 2003 | $98,000 | $134,900 | 2 / 0 | ||
| 2002 | $66,950 | $122,000 | 2 / 0 | ||
| 2001 | $55,000 | $115,000 | 1 / 0 | ||
| 2000 | $40,000 | $105,000 | 2 / 0 | ||
| 1999 | $50,000 | $102,000 | 1 / 0 | ||
| 1998 | $49,850 | $99,000 | 4 / 0 | ||
| 1997 | $28,000 | $90,000 | 1 / 0 | ||
| 1996 | $40,000 | $90,000 | 1 / 0 | ||
| 1995 | $30,500 | $85,000 | 3 / 0 | ||
| 1994 | $79,000 | 0 / 0 | |||
| 1993 | $77,500 | 0 / 0 | |||
| 1992 | $18,000 | $73,300 | 1 / 0 | ||
| 1991 | $21,750 | $68,500 | 2 / 0 | ||
| 1990 | $19,500 | $68,000 | 1 / 0 | ||
| 1989 | $10,500 | $63,000 | 2 / 0 | ||
| 1988 | $35,000 | $61,850 | 1 / 0 | ||
| 1987 | $9,800 | $61,400 | 1 / 0 | ||
| 1986 | $59,500 | 0 / 0 | |||
| 1985 | $16,900 | $58,900 | 2 / 0 | ||
| 1984 | $55,000 | 0 / 0 | |||
| 1983 | $11,000 | $54,000 | 1 / 0 | ||
| 1982 | $54,500 | 0 / 0 | |||
| 1981 | $51,300 | 0 / 0 | |||
| 1980 | $8,500 | $47,500 | 5 / 0 | ||
| 1979 | $44,500 | 0 / 0 | |||
| 1978 | $40,000 | 0 / 0 | |||
| 1977 | $23,800 | $37,000 | 1 / 0 | ||
| 1976 | $35,500 | 0 / 0 | |||
| 1975 | $12,400 | $36,500 | 1 / 0 | ||
| 1974 | $32,300 | 0 / 0 | |||
| 1973 | $16,700 | $28,500 | 3 / 0 | ||
| 1972 | $17,100 | $24,300 | 4 / 0 | ||
| 1971 | $15,000 | $18,600 | 1 / 0 |
How Much Are Bond Homes Worth?
Median home value, in price per square foot, each year in Bond, existing homes and new construction, with 2026 covering January to November
Medians describe the homes that sold each year, not the value of any one Bond home.
A dot on its own marks a year with sales but no sales the year before or after.
Sources: Tallahassee Board of Realtors Multiple Listing Service and the Leon County Property Appraiser. Sales updated November 12, 2026.
New construction and existing homes are always charted separately, so a year's new-construction figure can come from just one or two sales.
Annual figures
| Year | Bond existing homes | Bond new construction | Leon County existing homes | Leon County new construction | Bond sales (existing / new) |
|---|---|---|---|---|---|
| 2026 | $144 | $199 | $236 | 1 / 0 | |
| 2025 | $148 | $194 | $244 | 2 / 0 | |
| 2024 | $160 | $193 | $239 | 3 / 0 | |
| 2023 | $186 | $231 | 0 / 0 | ||
| 2022 | $48 | $162 | $170 | $208 | 3 / 1 |
| 2021 | $105 | $152 | $183 | 4 / 0 | |
| 2020 | $83 | $137 | $173 | 1 / 0 | |
| 2019 | $56 | $126 | $172 | 2 / 0 | |
| 2018 | $54 | $123 | $171 | 1 / 0 | |
| 2017 | $46 | $117 | $164 | 4 / 0 | |
| 2016 | $113 | $155 | 0 / 0 | ||
| 2015 | $110 | $152 | 0 / 0 | ||
| 2014 | $107 | $147 | 0 / 0 | ||
| 2013 | $105 | $144 | 0 / 0 | ||
| 2012 | $100 | $137 | 1 / 0 | ||
| 2011 | $102 | $130 | 0 / 0 | ||
| 2010 | $109 | $122 | 0 / 0 | ||
| 2009 | $113 | $127 | 0 / 0 | ||
| 2008 | $122 | $131 | 1 / 0 | ||
| 2007 | $70 | $89 | $129 | $138 | 4 / 2 |
| 2006 | $111 | $130 | $136 | 1 / 0 | |
| 2005 | 3 / 0 | ||||
| 2004 | 3 / 0 | ||||
| 2003 | 2 / 0 | ||||
| 2002 | 2 / 0 | ||||
| 2001 | 1 / 0 | ||||
| 2000 | 2 / 0 | ||||
| 1999 | 1 / 0 | ||||
| 1998 | 4 / 0 | ||||
| 1997 | 1 / 0 | ||||
| 1996 | 1 / 0 | ||||
| 1995 | 3 / 0 | ||||
| 1994 | 0 / 0 | ||||
| 1993 | 0 / 0 | ||||
| 1992 | 1 / 0 | ||||
| 1991 | 2 / 0 | ||||
| 1990 | 1 / 0 | ||||
| 1989 | 2 / 0 | ||||
| 1988 | 1 / 0 | ||||
| 1987 | 1 / 0 | ||||
| 1986 | 0 / 0 | ||||
| 1985 | 2 / 0 | ||||
| 1984 | 0 / 0 | ||||
| 1983 | 1 / 0 | ||||
| 1982 | 0 / 0 | ||||
| 1981 | 0 / 0 | ||||
| 1980 | 5 / 0 | ||||
| 1979 | 0 / 0 | ||||
| 1978 | 0 / 0 | ||||
| 1977 | 1 / 0 | ||||
| 1976 | 0 / 0 | ||||
| 1975 | 1 / 0 | ||||
| 1974 | 0 / 0 | ||||
| 1973 | 3 / 0 | ||||
| 1972 | 4 / 0 | ||||
| 1971 | 1 / 0 |
How Big Are the Homes That Sell in Bond?
Median home size, in square feet, each year in Bond, existing homes and new construction, with 2026 covering January to November
Medians describe the homes that sold each year, not the value of any one home.
A dot on its own marks a year with sales but no sales the year before or after.
Sources: Tallahassee Board of Realtors Multiple Listing Service and the Leon County Property Appraiser. Sales updated November 12, 2026.
New construction and existing homes are always charted separately, so a year's new-construction figure can come from just one or two sales.
Annual figures
| Year | Bond existing homes | Bond new construction | Leon County existing homes | Leon County new construction | Bond sales (existing / new) |
|---|---|---|---|---|---|
| 2026 | 975 | 1,569 | 1,873 | 1 / 0 | |
| 2025 | 981 | 1,544 | 1,747 | 2 / 0 | |
| 2024 | 768 | 1,522 | 1,786 | 3 / 0 | |
| 2023 | 1,488 | 1,791 | 0 / 0 | ||
| 2022 | 1,027 | 1,284 | 1,476 | 1,935 | 3 / 1 |
| 2021 | 1,213 | 1,502 | 1,807 | 4 / 0 | |
| 2020 | 900 | 1,581 | 1,757 | 1 / 0 | |
| 2019 | 1,220 | 1,569 | 1,670 | 2 / 0 | |
| 2018 | 975 | 1,550 | 1,791 | 1 / 0 | |
| 2017 | 1,025 | 1,594 | 1,744 | 4 / 0 | |
| 2016 | 1,626 | 1,803 | 0 / 0 | ||
| 2015 | 1,682 | 1,764 | 0 / 0 | ||
| 2014 | 1,696 | 1,876 | 0 / 0 | ||
| 2013 | 1,700 | 2,010 | 0 / 0 | ||
| 2012 | 1,729 | 1,987 | 1 / 0 | ||
| 2011 | 1,703 | 1,783 | 0 / 0 | ||
| 2010 | 1,644 | 1,573 | 0 / 0 | ||
| 2009 | 1,537 | 1,487 | 0 / 0 | ||
| 2008 | 1,504 | 1,570 | 1 / 0 | ||
| 2007 | 1,725 | 1,508 | 1,465 | 1,535 | 4 / 2 |
| 2006 | 1,144 | 1,469 | 1,470 | 1 / 0 | |
| 2005 | 3 / 0 | ||||
| 2004 | 3 / 0 | ||||
| 2003 | 2 / 0 | ||||
| 2002 | 2 / 0 | ||||
| 2001 | 1 / 0 | ||||
| 2000 | 2 / 0 | ||||
| 1999 | 1 / 0 | ||||
| 1998 | 4 / 0 | ||||
| 1997 | 1 / 0 | ||||
| 1996 | 1 / 0 | ||||
| 1995 | 3 / 0 | ||||
| 1994 | 0 / 0 | ||||
| 1993 | 0 / 0 | ||||
| 1992 | 1 / 0 | ||||
| 1991 | 2 / 0 | ||||
| 1990 | 1 / 0 | ||||
| 1989 | 2 / 0 | ||||
| 1988 | 1 / 0 | ||||
| 1987 | 1 / 0 | ||||
| 1986 | 0 / 0 | ||||
| 1985 | 2 / 0 | ||||
| 1984 | 0 / 0 | ||||
| 1983 | 1 / 0 | ||||
| 1982 | 0 / 0 | ||||
| 1981 | 0 / 0 | ||||
| 1980 | 5 / 0 | ||||
| 1979 | 0 / 0 | ||||
| 1978 | 0 / 0 | ||||
| 1977 | 1 / 0 | ||||
| 1976 | 0 / 0 | ||||
| 1975 | 1 / 0 | ||||
| 1974 | 0 / 0 | ||||
| 1973 | 3 / 0 | ||||
| 1972 | 4 / 0 | ||||
| 1971 | 1 / 0 |
Bond Recent Sales
| Address | Price | Price / sq ft | Closing date | Year built | Sq ft | Sale type |
|---|---|---|---|---|---|---|
| $140,000 | $144 | 2026-05-11 | 1971 | 975 | Existing | |
| $123,000 | $171 | 2025-07-16 | 1982 | 720 | Existing | |
| $155,000 | $125 | 2025-05-02 | 1990 | 1,242 | Existing | |
| $115,000 | $160 | 2024-11-08 | 1982 | 720 | Existing | |
| $180,000 | $150 | 2024-08-30 | 1971 | 1,200 | Existing | |
| $167,000 | $217 | 2024-08-19 | 1956 | 768 | Existing | |
| $23,800 | $36 | 2022-10-17 | 1932 | 662 | Existing | |
| $208,500 | $162 | 2022-09-27 | 2022 | 1,284 | New | |
| $82,500 | $59 | 2022-07-07 | 1953 | 1,392 | Existing | |
| $68,000 | 2022-06-14 | 1971 | Existing | |||
| $62,000 | 2021-11-22 | 1956 | Existing | |||
| $135,000 | $105 | 2021-09-10 | 1967 | 1,281 | Existing | |
| $120,000 | $105 | 2021-07-28 | 2006 | 1,144 | Existing | |
| $60,500 | 2021-04-30 | 1956 | Existing | |||
| $74,500 | $83 | 2020-12-11 | 2008 | 900 | Existing | |
| $100,000 | $52 | 2019-12-02 | 1969 | 1,936 | Existing | |
| $30,000 | $60 | 2019-08-26 | 1967 | 504 | Existing | |
| $53,000 | $54 | 2018-07-09 | 1972 | 975 | Existing | |
| $28,000 | 2017-10-13 | 1955 | Existing | |||
| $54,500 | $49 | 2017-10-11 | 1958 | 1,108 | Existing | |
| $33,500 | 2017-09-15 | 1946 | Existing | |||
| $40,000 | $42 | 2017-05-22 | 1956 | 942 | Existing | |
| $25,000 | 2012-12-28 | 1960 | Existing | |||
| $81,000 | 2008-05-30 | 1953 | Existing | |||
| $133,000 | $88 | 2007-12-31 | 2007 | 1,508 | New | |
| $134,900 | $89 | 2007-09-14 | 2007 | 1,508 | New | |
| $105,000 | $69 | 2007-05-11 | 1959 | 1,514 | Existing | |
| $135,000 | $70 | 2007-04-30 | 1969 | 1,936 | Existing | |
| $94,000 | 2007-02-23 | 1958 | Existing | |||
| $174,900 | 2007-01-10 | 2001 | Existing | |||
| $127,000 | $111 | 2006-06-28 | 2006 | 1,144 | Existing | |
| $75,500 | 2005-11-18 | 1990 | Existing | |||
| $135,000 | 2005-07-08 | 1956 | Existing | |||
| $72,500 | 2005-03-23 | 1963 | Existing | |||
| $100,000 | 2004-10-29 | 1959 | Existing | |||
| $88,000 | 2004-06-18 | 1971 | Existing | |||
| $25,000 | 2004-01-05 | 1960 | Existing | |||
| $98,000 | 2003-04-30 | 2001 | Existing | |||
| $98,000 | 2003-02-28 | 2001 | Existing | |||
| $73,900 | 2002-08-07 | 1959 | Existing | |||
| $60,000 | 2002-03-27 | 1965 | Existing | |||
| $55,000 | 2001-06-14 | 1959 | Existing | |||
| $35,000 | 2000-07-01 | 1956 | Existing | |||
| $45,000 | 2000-01-01 | 1967 | Existing | |||
| $50,000 | 1999-07-01 | 1964 | Existing | |||
| $58,000 | 1998-09-01 | 1964 | Existing | |||
| $44,000 | 1998-07-01 | 1960 | Existing | |||
| $55,700 | 1998-06-01 | 1969 | Existing | |||
| $29,500 | 1998-04-01 | 1958 | Existing | |||
| $28,000 | 1997-09-01 | Existing | ||||
| $40,000 | 1996-12-01 | 1973 | Existing | |||
| $40,600 | 1995-07-10 | 1956 | Existing | |||
| $18,000 | 1995-05-01 | Existing | ||||
| $30,500 | 1995-05-01 | 1953 | Existing | |||
| $18,000 | 1992-04-01 | 1946 | Existing | |||
| $41,500 | 1991-01-01 | 1969 | Existing | |||
| $2,000 | 1991-01-01 | 1945 | Existing | |||
| $19,500 | 1990-01-01 | 1973 | Existing | |||
| $11,000 | 1989-01-01 | 1967 | Existing | |||
| $10,000 | 1989-01-01 | 1940 | Existing | |||
| $35,000 | 1988-01-01 | 1967 | Existing | |||
| $9,800 | 1987-10-06 | Existing | ||||
| $13,600 | 1985-01-01 | 1932 | Existing | |||
| $20,200 | 1985-01-01 | 1973 | Existing | |||
| $11,000 | 1983-01-01 | 1943 | Existing | |||
| $18,000 | 1980-01-01 | 1929 | Existing | |||
| $8,000 | 1980-01-01 | 1932 | Existing | |||
| $8,500 | 1980-01-01 | 1956 | Existing | |||
| $20,100 | 1980-01-01 | 1969 | Existing | |||
| $5,300 | 1980-01-01 | 1943 | Existing | |||
| $23,800 | 1977-01-01 | 1973 | Existing | |||
| $12,400 | 1975-01-01 | Existing | ||||
| $4,800 | 1973-01-01 | 1920 | Existing | |||
| $18,800 | 1973-01-01 | 1972 | Existing | |||
| $16,700 | 1973-01-01 | 1973 | Existing | |||
| $4,800 | 1972-01-01 | 1935 | Existing | |||
| $16,700 | 1972-01-01 | 1971 | Existing | |||
| $17,500 | 1972-01-01 | 1971 | Existing | |||
| $17,500 | 1972-01-01 | 1972 | Existing | |||
| $15,000 | 1971-01-01 | 1953 | Existing |
Showing 25 of 80 sales
Sources: the Leon County Property Appraiser and the MLS.
Schools
Schools Serving Bond
2026–27 attendance zones
Assigned Public Schools
All homes in Bond are zoned for Bond Elementary School, Nims Middle School, and Leon High School.
Bond Elementary School is 0.5 miles from Bond and has a Florida DOE school grade of A (2026). Its phone number is (850) 488-7676.
Nims Middle School is 1.0 miles away and has a Florida DOE school grade of D (2026). Its phone number is (850) 617-6161.
Leon High School is 2.6 miles away and has a Florida DOE school grade of B (2026). Its phone number is (850) 617-5700.
Bond Elementary SchoolFlorida DOE school grade: A (2026)All 109 homes in Bond
Nims Middle SchoolFlorida DOE school grade: D (2026)All 109 homes in Bond
Leon High SchoolFlorida DOE school grade: B (2026)All 109 homes in Bond
School zones can change from time to time, so check the current assignment for the exact address before you buy.
The Leon County Schools zone lookup shows the assigned schools for any address.
Other Schools Nearby
Charter Schools
These are tuition-free public schools open to students from any Leon County address.
| School | Driving Distance | Phone | Florida DOE school grade |
|---|---|---|---|
| Tallahassee Classical SchoolPK–12 | 4.6 miles | (850) 296-1970 | B (2026) |
| Florida State University SchoolsK–12 | 6.4 miles | (850) 245-3700 | A (2026) |
| School of Arts and Sciences on ThomasvilleK–8 | 5.9 miles | (850) 386-6566 | A (2026) |
| School of Arts and Sciences at the CentreK–8 | 4.4 miles | (850) 999-8267 | B (2026) |
| Tallahassee School of Math and ScienceK–8 | 6.5 miles | (850) 681-7827 | B (2026) |
Private Schools
The state does not grade these schools. They are listed nearest to Bond first.
Buying in Bond
Buying a Home in Bond
On average, two homes in Bond come up for sale each year, 1.8% of the neighborhood, so a buyer who wants to live here has to be ready when one does. Ready means you choose your agent first, build the plan together, and then find the house. Our plan is to negotiate from what the home is worth, not from an inflated asking price. Ask us for the plan before you start looking.
Plan Your Bond SearchTo see every home for sale that fits your search, in Bond or nearby, use the Home Finder.
If you plan to buy here, the Tallahassee home buying guide lays out the steps in order.
To turn a Bond price into a monthly payment, use the mortgage calculator.
Selling in Bond
Selling a Home in Bond
Most sellers negotiate with one buyer at a time. Our selling plan is built to bring several buyers together so they compete for your home. Ask us how that plan would work when you sell in Bond.
If you own a home here and plan to sell, the Tallahassee home selling guide covers what to decide before the home goes on the market.
To learn what your Bond home is worth today, request a home evaluation.
The home marketing plan shows how our selling plan is built to bring several buyers to the same home.
Bond questions
Bond Frequently Asked Questions
Are new homes still being built in Bond?
Not right now. The newest home in Bond was built in 2022, and 51 lots are still vacant, so new homes could still go up.
What homes have recently sold in Bond?
The most recent sale in Bond was 1820 Keith St, which sold for $140,000 on May 11, 2026. Before that, 1809 Holton St sold for $123,000 on July 16, 2025, and 1700 Keith St sold for $155,000 on May 2, 2025. See all 80 recent sales in the table above.
What types of homes are in Bond?
All 109 homes in Bond are single-family homes. The median home size is 1,120 square feet of heated and cooled space, and the most common layout is three bedrooms and two bathrooms.
What are the HOA dues in Bond?
Bond has no homeowners association, and there are no association dues.
Which public schools serve the Bond neighborhood?
Bond Elementary School, Nims Middle School, and Leon High School. School zones can change from time to time, so confirm the current assignment for the home you choose with your Joe Manausa Team member.
Are homes in Bond in a flood zone?
No. None of the 109 lots in Bond are in a FEMA 1%-chance flood zone.
How old are the homes in Bond?
Homes in Bond were built from 1920 through 2022. The median year built is 1958, so half the homes are older than 68 years and half are newer.
How should a home in Bond be valued?
A home in Bond is best valued against recent sales of similar homes here, adjusted for differences in size, condition, updates and lot. Online estimates can't see inside a home, so for a figure on one home, request a home evaluation from a Joe Manausa Team member.
Questions about one Bond address
Ready to Talk About a Bond Property?
This page describes Bond as a whole, not the one home you have in mind. Bring your questions about that home to a Joe Manausa Team member before you decide.
For local services you may need before or after a move, see our preferred vendor list.