
 New home construction is an important segment of the overall housing market.
If we produce too many homes, it creates an oversupply that causes downward pressure on home values. If we produce too few new homes, the opposite is true, and values move higher at too fast a rate.
The latter is the situation we’ve observed since 2016, and it has motivated us to produce regular (checkups) on how the new homes market is faring. Today’s report includes graphs that show how many homes have been built and sold, as well as how well the market has received them.
First, let’s start by looking at the new construction homes for sale in Tallahassee.
New Construction Homes For Sale
New Home Construction Listings




Delta Between New And Used Is Closing
I like to track the average value of both new and existing homes that have sold in order to see how far apart they are. In this graph, we’ve plotted the average new home value (in price per square foot) in red, and existing home values are plotted in blue. The difference (the Delta) is plotted in gray (highlighted in yellow) and is reported on the right vertical axis.
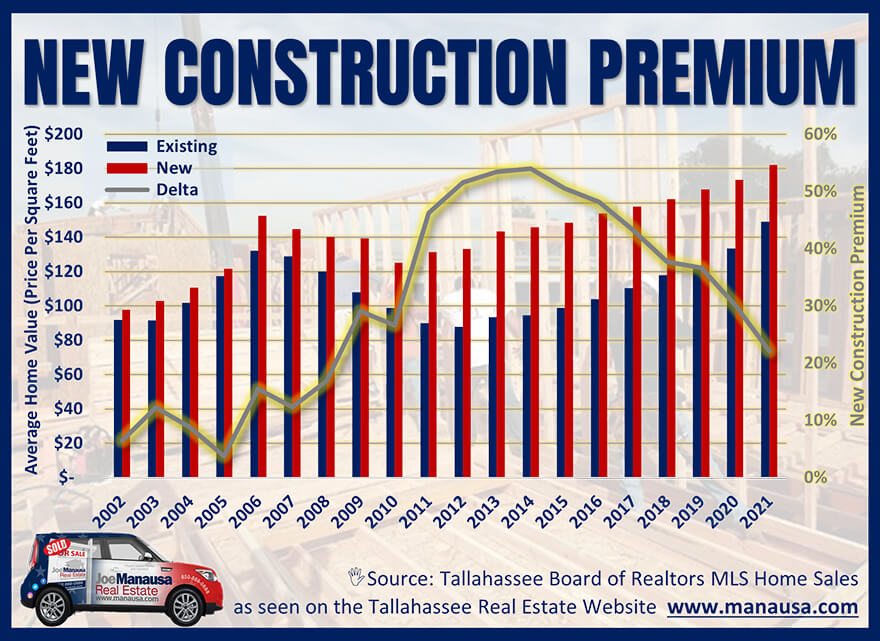
The important trend in this graph is found by following the delta between the two, and it has fallen to 22%, the lowest we’ve seen in more than twelve years! Simply put, relative to used homes, new homes are more affordable than we’ve seen since 2008!
If you want to get a glimpse of what helped fuel the growth the caused the housing bubble 15 years ago, just look at the delta for the first seven years in the graph. New homes and existing homes were (on average) only 10% apart, so it was very easy for builders to produce homes that the market would bear. Unfortunately, new home construction continued far longer than the demand would bear, adding too many homes to the inventory.
Today, we have a supply imbalance that is completely opposite of the pre-housing bubble years. We still have a need for more new homes and I’m concerned the slow pace of construction will push values so high that many buyers will soon be priced out of the market.
New Versus Used Home Sales
This next graph plots the number of homes sold each year, segmented by new versus existing homes. Note that all previous years are through December, while 2021 is through October.
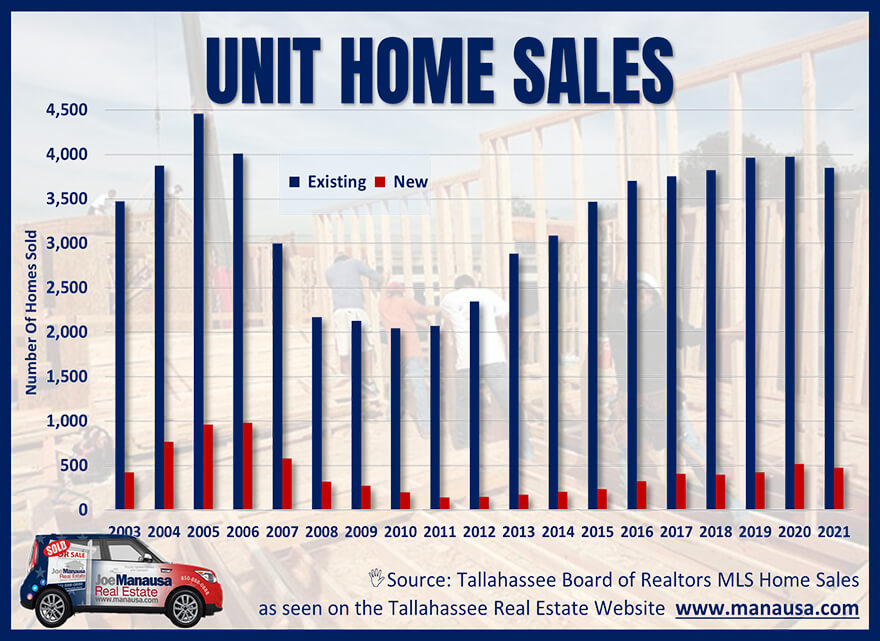
If you have any concerns about a housing bubble forming, the graph above should provide you with some relief. The number of new homes being built and sold is still below the levels we saw in the 1990s.
Unfortunately, we are seeing a big problem forming in housing. No, not a bubble that is going to see values tumble, instead, we’re seeing affordability dwindle. This could easily trap many homeowners into their present homes.
While homeowners will be accumulating a lot of equity, they will have a hard time converting it to another home as both the cost of real estate and the cost of borrowing money will be moving at historically high rates.
How Appreciation Rates Differ Between New And Used Homes
This graph plots the change in the average price per square foot of new and used homes. New homes values are plotted in red, while used home values are plotted in blue.

Since 2013, existing homes have been growing in value. In 2016, the market hit equilibrium (the level where supply and demand are balanced), and since that time the pace of appreciation has moved to higher levels.
Prior to the year starting, I forecast double-digit appreciation and was concerned we might see it hit 20%. That fear has not been realized, but appreciation through ten months is at 11.9% so we’re still looking at “out of control” growth in home values.
We have been seeing mortgage interest rates finally starting to push higher and they are currently just below 3.25% (last year they were right around 3%). It’s likely the future includes additional mortgage interest rate hikes that will slow demand and help balance the relationship between buyers and sellers.
How Fragile Is Our Housing Market?







Housing Crash or Boom? Here’s What’s Coming in 2025