
Today, we delve into the topic of building permits, as the lack of home affordability has become a widely discussed issue in the media.
The shortfall in new single-family home permits and multi-family property permits and construction exacerbates the current housing crisis. I aim to present the data that highlights the significant underdevelopment in the housing market as of 2023 rather than warning of a housing bubble that is not forming.
Join me as I showcase graphs and tables that demonstrate the formation of this issue and the reality of what we’re facing. Whether or not you have plans to move, this information is crucial for you to make informed decisions about your future as it affects both home values and rental rates.
New Construction For Sale
The following listings are for all new construction single-family homes for sale listed in the Tallahassee MLS:
New Construction Homes For Sale




Single-Family Building Permits Are Not Recovering
For more than six years, I have consistently emphasized through my videos and blog posts that we are facing a housing shortage. The accompanying graph solidifies my conviction in this truth.
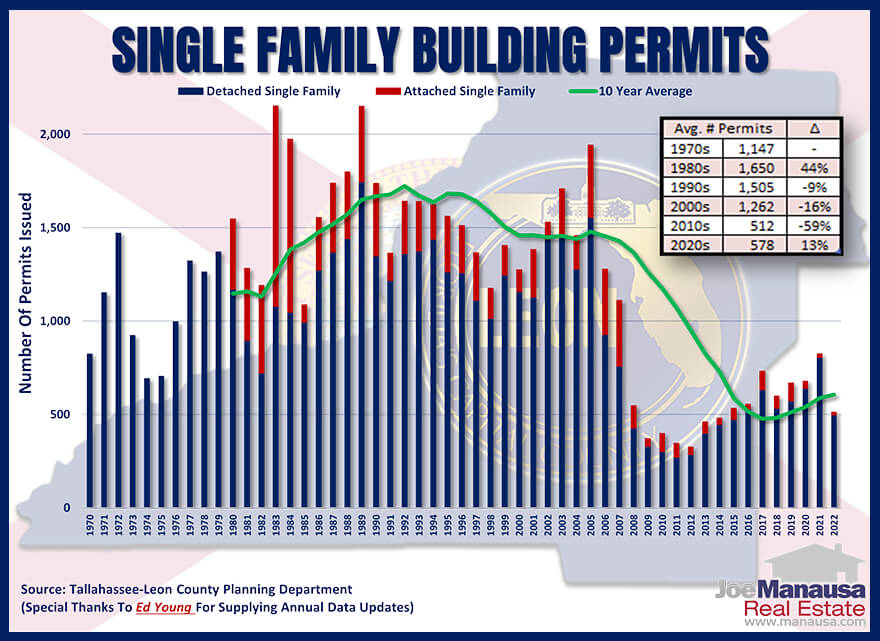
The graph above tracks the number of single-family building permits each year, with detached homes plotted in blue and attached homes plotted in red. The green line plots the total ten-year average number of single-family building permits issued yearly.
Over the forty years from 1970 to 2010, Leon County typically approved the construction of around 1,500 single-family homes annually. However, in the last decade, this average has plummeted by 64% to a mere 545 homes per year. This significant drop in production would not pose such a problem if an increase in multi-family homes offset it. Sadly, as depicted in the following graph, that is not the case.
Multi-Family Construction Remains Stable
People have to live somewhere. If not in single-family homes, then multi-family is the most likely alternative.

This graph plots the number of multi-family building permits in Leon County each year in red and shows the ten-year average as a solid blue line. While single-family building permits declined by 64%, multi-family permits have fallen by 21% when comparing the past 13-year average with the previous 40-year average.
Even with all the new student rental properties recently built near the universities, there hasn’t been much change in the multi-family market. I expect this will change as building costs and mortgage interest rates have increased significantly, each adding to the home affordability problem.
Residential Building Permits Needed
There is a significant challenge in the housing market when considering both single-family and multi-family permits issued.

The graph above brings together the information from the prior two graphs and presents a striking illustration of the shortage in the supply aspect of the housing market. Over the past fourteen years, residential permits issued have dropped by 44% compared to the average from the preceding 40-year period.
This is not just a temporary anomaly in the data but a clear indication that we are moving towards a housing affordability crisis that will affect homeowners and renters. In the following section, we delve into some intriguing insights about home values and how the decrease in new construction has impacted them.
Get Our Free Market Update
Other buyers, sellers, lenders, and real estate agents have this critical information, and now you can too!
Get immediate access to our most recent newsletter.
Let more than 30 years of experience work for you with charts, graphs, and analysis of the Tallahassee housing market.
Each Monday morning we send out a simple, one-page report that provides a snapshot of the Tallahassee housing market. It only takes 2 minutes to read, but it gives you better market intelligence than most real estate agents possess. Just tell us where to send it below!
New Versus Existing Home Values
This graph displays the alarming transformation in the average price per square foot for both new and existing homes. The values for new homes are represented in red while existing home values are depicted in blue.

Existing home values are entirely determined by market forces, driven by the principles of supply and demand. On the other hand, the values (or costs) of new construction homes are less influenced by market forces, as builders cannot build for less when demand drops though costs are still rising. If consumers are unwilling (or unable) to pay the cost of a newly built home, then builders will cease construction.
The considerable decrease in new home construction over the last 15 years has had a noticeable and substantial impact on the values of existing homes. With an insufficient supply of housing to meet the demands of our growing population, the values of existing homes have been rapidly increasing.
Over the past eight years, existing home values have increased at an average yearly rate of 7.4%, while new home values have risen at a yearly rate of 4.5%. This has caused both values to converge slightly, as demonstrated in the upcoming graph.



Fannie Mae Report: It's The TRUTH About The Housing Market
Real Estate Meltdown: Starter Homes at $1M in 233 Cities

Is the Housing Market Crashing? | Redfin April 2025 Update

Is This The CALM Before The CRASH? Volatility Rocks Housing

Warning Signs For Home Buyers And Sellers
The Difference Between New And Used Home Values
In this graph, the average value of new homes (in terms of price per square foot) is depicted in red, and the average value of existing homes is shown in blue. The difference between the two is plotted in gray and is displayed on the right vertical axis.

The data indicates that the gap between new and existing home values has reached its lowest point in thirteen years, with new homes becoming more affordable relative to used homes since 2011.
In the past, the difference between new and existing home values was less than 10%, which is a stark contrast to the present day, where the cost of new construction has risen significantly due to factors such as increased construction costs, supply chain disruptions, labor shortages, minimum wage hikes, and a limited supply of affordable land. This has resulted in housing scarcity, leading to the rapid appreciation of existing homes.
The current market conditions differ from the housing bubble of 2006, when an abundance of speculators flooded the market, leading to a supply surplus. Today, most homes for sale are from homeowners who are moving rather than builders.
When mortgage interest rates doubled last year, the demand for homes tumbled. Unfortunately, the supply of homes for sale has not started to rebound, as new construction is not filling the void. When a buyer leaves the market due to affordability issues, it often means that a seller is leaving the market (as most homebuyers have a home to sell too).
With inflation expected to continue impacting the construction industry, new home values are likely to rise by 5% or more, putting additional pressure on existing homes and leading to further appreciation.
The Federal Reserve’s actions this year will be crucial in determining the housing market’s direction. If the Fed Funds Rate remains fairly stable, builders may be able to begin to meet the needs of the growing population. On the other hand, continued increases from the Fed could result in most homebuilding being carried out by investors building homes to rent rather than sell. Either way, new homes are needed, so the big question will center around affordability and whether or not consumers can afford to own a home.
We will closely monitor the various factors affecting the housing market and provide updates through our periodic reports here and on our YouTube Channel. A table displaying the newest sales of newly constructed homes can be found below for those interested in where new homes are currently being built.
Recent New Home Construction Sales
The table below highlights the latest 1,000 sales of newly built homes in Tallahassee. You can rearrange the table information by clicking on any column heading.
New Construction Sales In Tallahassee
| Neighborhood | Address | Price | Price / SQF | Closing Date | Year Built | SQF |
|---|---|---|---|---|---|---|
| Canopy | 3917 Ardmore Ln | $600,000 | $252 | 2026-10-09 | 2026 | 2,378 |
| Fletcher Oaks | 487 Grand Oaks Rd | $405,000 | $225 | 2026-10-09 | 2023 | 1,804 |
| Campbell Park | 3399 Mizell St | $290,000 | $223 | 2026-10-07 | 2026 | 1,301 |
| Fallschase | 540 Bienville Pl | $687,900 | $238 | 2026-10-01 | 2026 | 2,890 |
| Plaza Tower | 300 S Duval St | $310,000 | $261 | 2026-10-01 | 2009 | 1,186 |
| Fallschase | 4106 Beauregard Way | $460,000 | $209 | 2026-09-30 | 2026 | 2,200 |
| Fallschase | 543 Bienville Pl | $369,100 | $240 | 2026-09-30 | 2026 | 1,535 |
| Landon Hills | 8364 Bull Headley Rd | $451,600 | $251 | 2026-09-30 | 2025 | 1,802 |
| Landon Hills | 8388 Bull Headley Rd | $441,600 | $245 | 2026-09-29 | 2026 | 1,802 |
| Abilene Acres | 709 Dailey Dr | $279,900 | $192 | 2026-09-28 | 2026 | 1,459 |
| Pine Dove Estates | 5576 White Dove Trl | $435,000 | $242 | 2026-09-28 | 2026 | 1,799 |
| Fallschase | 420 Kenyon Pl | $339,900 | $179 | 2026-09-25 | 2026 | 1,895 |
| Canopy | 3925 Ardmore Ln | $575,300 | $250 | 2026-09-23 | 2026 | 2,302 |
| Tower Gates | 4498 River Breeze Ln | $298,000 | $217 | 2026-09-23 | 2025 | 1,374 |
| Plaza Tower | 300 S Duval St Apt 1111 | $315,000 | $265 | 2026-09-21 | 2009 | 1,188 |
| Canopy | 3749 Meadow Vista Ln | $426,600 | $236 | 2026-09-18 | 2025 | 1,804 |
| Fallschase | 215 Calcasieu Pass | $499,900 | $218 | 2026-09-18 | 2026 | 2,295 |
| Fallschase | 517 Dartez Ct | $399,900 | $239 | 2026-09-18 | 2026 | 1,670 |
| Capital Heights | 530 W 4TH Ave | $315,000 | $222 | 2026-09-18 | 2026 | 1,420 |
| Abilene Acres | 4876 Six Mile Pond Loop | $289,900 | $199 | 2026-09-18 | 2026 | 1,459 |
| None | 1520 Summerbrooke Dr | $530,700 | $283 | 2026-09-16 | 2026 | 1,873 |
| Fallschase | 424 Kenyon Pl | $342,900 | $181 | 2026-09-15 | 2026 | 1,895 |
| The Franklin | 275 S Franklin Blvd Unit 6 | $680,000 | $334 | 2026-09-15 | 2025 | 2,038 |
| Abilene Acres | 4884 Six Mile Pond Loop | $302,300 | $206 | 2026-09-15 | 2026 | 1,470 |
| Olson Ridge | 2951 Ervine St | $400,900 | $177 | 2026-09-14 | 2025 | 2,259 |
| Southwood | 4075 Four Oaks Blvd | $399,900 | $236 | 2026-09-11 | 2026 | 1,695 |
| None | 1536 Summerbrooke Dr | $598,100 | $233 | 2026-09-08 | 2025 | 2,572 |
| Pine Dove Estates | 5360 Pine Dove Dr | $562,900 | $195 | 2026-09-04 | 2026 | 2,890 |
| Canopy | 3789 Meadow Vista Ln | $661,600 | $256 | 2026-09-03 | 2026 | 2,582 |
| Conservation Of Summerbrooke | 1491 Summerbrooke Dr | $629,900 | $243 | 2026-09-03 | 2026 | 2,589 |
| Fallschase | 418 Kenyon Pl | $339,900 | $179 | 2026-08-31 | 2026 | 1,895 |
| Fallschase | 416 Kenyon Pl | $349,000 | $186 | 2026-08-31 | 2026 | 1,876 |
| Conservation Of Summerbrooke | 1431 Summerbrooke Dr | $532,800 | $284 | 2026-08-31 | 2025 | 1,873 |
| Hammock At Oak Grove | 589 Knotted Pine Dr | $581,300 | $272 | 2026-08-28 | 2026 | 2,137 |
| Hammock At Oak Grove | 585 Knotted Pine Dr | $619,900 | $291 | 2026-08-25 | 2024 | 2,130 |
| None | 8548 Scott Tower Rd | $580,000 | $269 | 2026-08-24 | 2026 | 2,160 |
| Landon Hills | 1379 Landon Hills Dr | $248,000 | $194 | 2026-08-21 | 2026 | 1,280 |
| Pine Dove Estates | 5584 White Dove Trl | $564,900 | $195 | 2026-08-21 | 2026 | 2,890 |
| Fallschase | 4110 Beauregard Way | $503,500 | $197 | 2026-08-20 | 2026 | 2,550 |
| None | 1568 Summerbrooke Dr | $590,900 | $230 | 2026-08-20 | 2026 | 2,572 |
| Conservation Of Summerbrooke | 1488 Summerbrooke Dr | $504,200 | $269 | 2026-08-19 | 2025 | 1,873 |
| Pine Dove Estates | 7921 Lonesome Dove Ln | $526,800 | $217 | 2026-08-17 | 2026 | 2,429 |
| Canopy | 3909 Ardmore Ln | $647,400 | $251 | 2026-08-14 | 2026 | 2,582 |
| Canopy | 3799 Day Garden Dr | $442,000 | $224 | 2026-08-14 | 2023 | 1,975 |
| Homestead Ridge | 9350 Powderhorn Ave | $370,500 | $268 | 2026-08-14 | 2025 | 1,384 |
| None | 1552 Summerbrooke Dr | $834,800 | $242 | 2026-08-11 | 2026 | 3,447 |
| Fallschase | 4102 Beauregard Way | $450,000 | $205 | 2026-08-07 | 2026 | 2,200 |
| Town N Country Park | 934 Chestwood Ave | $367,200 | $245 | 2026-08-07 | 2026 | 1,501 |
| Fallschase | 519 Bienville Pl | $410,000 | $209 | 2026-08-05 | 2026 | 1,964 |
| Tower Gates | 4470 River Breeze Ln | $335,100 | $210 | 2026-08-05 | 2025 | 1,592 |
| Fallschase | 4272 Duhon St | $543,600 | $211 | 2026-08-04 | 2026 | 2,572 |
| Southwood | 4073 Four Oaks Blvd | $410,700 | $242 | 2026-07-30 | 2026 | 1,695 |
| Canopy | 2832 Mews Lndg | $305,700 | $239 | 2026-07-28 | 2026 | 1,280 |
| Bond South | 2002 Pasco St | $225,000 | $203 | 2026-07-24 | 2026 | 1,109 |
| Bond South | 2006 Pasco St | $225,000 | $203 | 2026-07-24 | 2026 | 1,109 |
| Conservation Of Summerbrooke | 1504 Summerbrooke Dr | $696,200 | $270 | 2026-07-23 | 2026 | 2,582 |
| Reserve At Rivers Landing | 4899 Sampler Dr | $311,000 | $225 | 2026-07-22 | 2026 | 1,382 |
| Tower Gates | 5736 Pinebarren Rd | $324,000 | $230 | 2026-07-20 | 2025 | 1,409 |
| Landon Hills | 1354 Landon Hills Dr | $402,500 | $248 | 2026-07-17 | 2024 | 1,622 |
| Canopy | 3905 Ardmore Ln | $599,800 | $252 | 2026-07-15 | 2026 | 2,378 |
| Canopy | 3829 Ardmore Ln | $579,600 | $252 | 2026-07-14 | 2025 | 2,302 |
| Canopy | 2349 Briar Rose Gln | $330,000 | $264 | 2026-07-10 | 2025 | 1,252 |
| Fallschase | 4236 Landry Ln | $440,500 | $279 | 2026-07-09 | 2026 | 1,580 |
| Landon Hills | 8373 Bull Headley Rd | $464,900 | $216 | 2026-07-08 | 2026 | 2,149 |
| Waterford Plantation | 6286 Longwood Ct | $557,000 | $257 | 2026-07-02 | 2024 | 2,170 |
| Canopy | 2374 Briar Rose Gln | $431,600 | $240 | 2026-07-01 | 2025 | 1,802 |
| Hammock At Oak Grove | 649 Knotted Pine Dr | $613,400 | $272 | 2026-07-01 | 2026 | 2,255 |
| Conservation Of Summerbrooke | 1471 Summerbrooke Dr | $667,900 | $259 | 2026-07-01 | 2026 | 2,582 |
| Maple Ridge | 2351 Maple Leaf Way | $1,420,000 | $310 | 2026-07-01 | 2024 | 4,587 |
| Fallschase | 515 Bienville Pl | $370,000 | $241 | 2026-06-30 | 2026 | 1,535 |
| Fallschase | 505 Dartez Ct | $399,900 | $239 | 2026-06-30 | 2026 | 1,670 |
| Southwood | 4061 Brownstone Way | $381,200 | $212 | 2026-06-30 | 2025 | 1,799 |
| Fallschase | 507 Bienville Pl | $430,000 | $196 | 2026-06-29 | 2026 | 2,198 |
| Conservation Of Summerbrooke | 1479 Summerbrooke Dr | $587,000 | $228 | 2026-06-29 | 2026 | 2,572 |
| Pine Dove Estates | 5598 White Dove Trl | $566,900 | $196 | 2026-06-29 | 2026 | 2,890 |
| Fallschase | 457 Dartez Ct | $399,900 | $239 | 2026-06-26 | 2026 | 1,670 |
| Tower Gates | 5700 Flowerbrook Cir | $340,000 | $214 | 2026-06-26 | 2026 | 1,592 |
| Pine Dove Estates | 5368 Pine Dove Dr | $624,900 | $205 | 2026-06-26 | 2026 | 3,044 |
| None | 1007 Williams Landing Rd | $1,169,000 | $408 | 2026-06-25 | 2024 | 2,864 |
| Key Acres | 2715 Gerald Dr | $295,800 | $164 | 2026-06-25 | 2023 | 1,800 |
| University Green | 1978 Greencastle Ln | $229,900 | $187 | 2026-06-23 | 2026 | 1,232 |
| Canopy | 3737 Meadow Vista Ln | $425,000 | $236 | 2026-06-22 | 2025 | 1,802 |
| Fallschase | 4247 Thibodeax Trl | $529,900 | $231 | 2026-06-22 | 2026 | 2,295 |
| Fallschase | 425 Dartez Ct | $399,900 | $239 | 2026-06-18 | 2026 | 1,670 |
| Landon Hills | 8377 Bull Headley Rd | $462,900 | $215 | 2026-06-18 | 2026 | 2,149 |
| Conservation Of Summerbrooke | 1463 Summerbrooke Dr | $568,900 | $277 | 2026-06-18 | 2025 | 2,055 |
| None | 4520 Garden Oaks Way | $424,900 | $190 | 2026-06-18 | 2025 | 2,239 |
| Canopy | 3825 Ardmore Ln | $580,000 | $252 | 2026-06-17 | 2025 | 2,302 |
| Fallschase | 360 Bienville Pl | $537,000 | $209 | 2026-06-17 | 2025 | 2,572 |
| Pine Dove Estates | Peace Dove Trl | $564,900 | $195 | 2026-06-17 | 2026 | 2,890 |
| Olson Ridge | 2909 Ervine St | $460,000 | $180 | 2026-06-16 | 2025 | 2,550 |
| Pine Dove Estates | 5370 Pine Dove Dr | $564,900 | $195 | 2026-06-16 | 2026 | 2,890 |
| Golden Eagle Plantation | 2875 Royal Isle Dr | $1,479,400 | $379 | 2026-06-12 | 2026 | 3,900 |
| Hammock At Oak Grove | 8419 Knotted Pine Ln | $579,400 | $272 | 2026-06-12 | 2025 | 2,130 |
| Hartsfield Hills | 1632 San Damian Rd | $499,000 | $257 | 2026-06-12 | 2025 | 1,939 |
| Reserve At Rivers Landing | 4909 Sampler Dr | $309,500 | $224 | 2026-06-09 | 2026 | 1,382 |
| Fallschase | 4248 Landry Ln | $446,700 | $283 | 2026-06-08 | 2026 | 1,580 |
| Conservation Of Summerbrooke | 1427 Summerbrooke Dr | $639,000 | $269 | 2026-06-08 | 2025 | 2,378 |
| Conservation Of Summerbrooke | 1443 Summerbrooke Dr | $618,400 | $260 | 2026-06-05 | 2025 | 2,378 |
| Canopy | 2347 Briar Rose Gln | $331,200 | $259 | 2026-06-03 | 2025 | 1,280 |

Tallahassee Housing Economic Update

Tallahassee Florida Spring Economic Update
Tallahassee/US Housing Market Update Feb 2024
Which Home Sizes Are Skyrocketing In 2024?

Top 10 Neighborhoods to Live in Tallahassee for Families

Wealth Gap Widens Luxury Home Market Booms Unprecedentedly
How Bad Is It? SHOCKING Building Permits Report!

Top 10 Patio Home Neighborhoods In Tallahassee