
Let’s start by looking at mortgage interest rates.
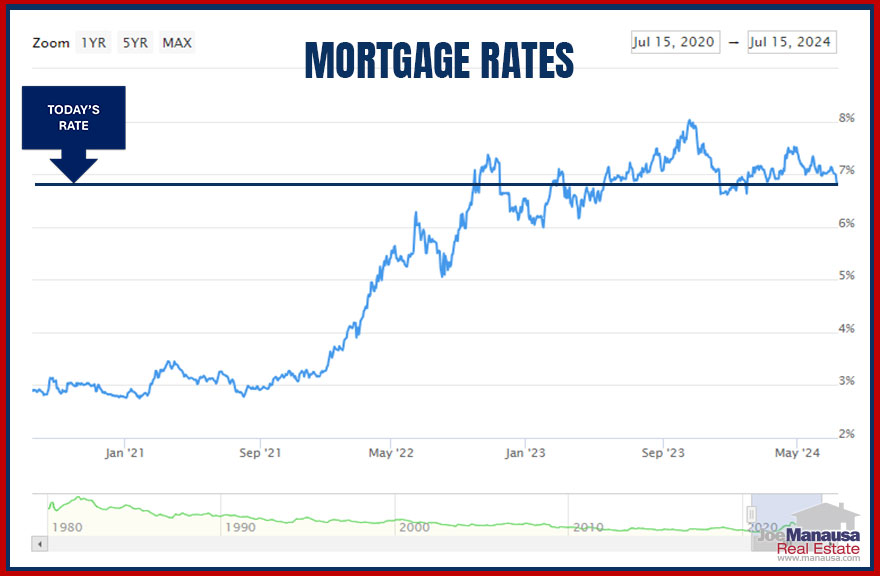
Redfin turned to Mortgage News Daily to find that the 30-year fixed mortgage interest rate has dropped to 6.81% as of mid-July, the lowest rate available to buyers since the end of January earlier this year.
To gain an understanding of what mortgage rate fluctuations mean to buyers who are actively looking for a home, I’ve created this simple table:
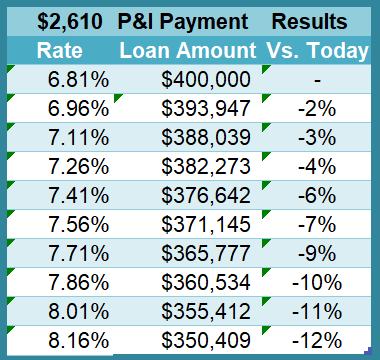
A person who can borrow $400K at the current rate could only borrow about $355K when rates surged above 8% in October. High prices and high rates have caused a lock-in effect, preventing existing homeowners from moving because they can’t afford to leave their homes, which are financed at historically low rates. The market will need time and natural move cycles to regain momentum.
Get Our Free Market Update
Other buyers, sellers, lenders, and real estate agents have this critical information, and now you can too!
Get immediate access to our most recent newsletter.
Let more than 30 years of experience work for you with charts, graphs, and analysis of the Tallahassee housing market.
Each Monday morning we send out a simple, one-page report that provides a snapshot of the Tallahassee housing market. It only takes 2 minutes to read, but it gives you better market intelligence than most real estate agents possess. Just tell us where to send it below!
US Median Home Price Report
Before I share Redfin’s home price findings, I’d like to share a recent exchange I had with a long-time reader of my weekly newsletter. He had just watched my last video about the lock-in effect and explained that he was warning young family members or friends to avoid buying high. In short, he believes homes are grossly inflated and will be dropping.
I suggested he reconsider his advice, pointing out that he might be biased by the recent memory of the 2008 housing market crash.

I explained that while home prices dropped during the Great Depression, the start of WWII, and the Great Recession, they have otherwise shown a consistent rise.
Although home prices will inevitably fall again at some point, they will generally trend upwards. To make specific forecasts, I focus on the supply and demand dynamic. For instance, the rate of newly built homes was cut in half over the past 16 years, leading to an estimated deficit of about 10 million homes in the US. The current market supply is barely above the all-time low recorded a few years ago.
Given this scenario, it is unlikely that home prices will decrease significantly. Historically, home prices tend to outpace inflation, which I believe might be under-reported. My advice to family members has been to think carefully before moving but to understand that the house they buy today will likely be much more valuable in 10 years.
According to Redfin, the median U.S. home price is up 5% year over year. But there are signs that price growth could slow soon, with the average home selling for under list price, inventory rising and a high share of listings growing stale.
The median U.S. home-sale price hit an all-time high of $397,482 during the four weeks ending July 7, up 4.7% year over year–the biggest increase in over four months. This marks the ninth straight week the median sale price has reached a new record high.





Fannie Mae Report: It's The TRUTH About The Housing Market

Real Estate Meltdown: Starter Homes at $1M in 233 Cities

Is the Housing Market Crashing? | Redfin April 2025 Update

Is This The CALM Before The CRASH? Volatility Rocks Housing

Warning Signs For Home Buyers And Sellers
MLS Manipulation – Some Data Cannot Be Trusted
One note regarding some of the statistics that Redfin is reporting. There are over 530 MLS systems across the US, and though I’ve used only three, I can confirm that extracting accurate market time or sales price performance data is nearly impossible.

Agents often manipulate listings to improve their apparent performance.
Relying on Redfin’s market time and selling price ratios to gauge market performance is like using a map where the landmarks have been deliberately misplaced. No matter how carefully you follow it, you’ll always end up in the wrong place because the foundational information is faulty. In the same way, when agents manipulate sales data, the resulting statistics become misleading, giving a distorted view of the market.
Supply Of Homes For Sale
Although inventory is still historically low, it is rising year over year, which is another sign that price growth may lose steam in the coming months.

New listings are up 7.3% year over year, and the total number of homes for sale is up 18.3%, with most homes for sale growing stale: More than 60% of homes are listed for at least a month without going under contract.
More homes are hitting the market partly because mortgage rates have been sitting at double pandemic-era lows for nearly two years, and sellers are tired of waiting for rates to drop before they move on to their next home.
Agents nationwide report that homes are sitting longer this year compared to the past few years, leading to slightly lower prices for some—but not all—homes. Buyers are cash-constrained due to higher prices and larger down payments, so sellers should prepare, price, and promote their homes carefully to attract the right buyers.
However, according to Redfin, one market segment is still moving quickly: move-in ready homes with large backyards in desirable school districts. In many markets, one-third of these listings sell immediately and at top dollar.








Housing Crash or Boom? Here’s What’s Coming in 2025

BIGGEST Housing Market Myth EXPOSED by New Foreclosure Data
What Are Home Sellers Getting?
Redfin reports that the typical U.S. home sold during the four weeks ending June 23 went for 0.3% less than its asking price.

However, as previously noted, this might reflect an asking price that has been adjusted multiple times. Nevertheless, this is the first time Redfin has reported that homes have sold below list price during the selling season since the pandemic began in 2020, when the housing market nearly came to a standstill. A year ago, the typical home sold for exactly its list price, and two years ago, it sold for about 2% above list price. Despite the questionable data, the trend of declining percentages seems accurate, though the specific decline amount is unclear due to Redfin’s data limitations.
Additionally, just under one-third (32.3%) of U.S. homes sold over asking price during that period. That’s the lowest share of any late springtime since 2020, when the housing market had nearly ground to a halt with the onset of the pandemic, and down from 36% a year earlier. Nearly 7% of home sellers dropped their asking price, on average, the highest level since November 2022 and up from 4.7% a year ago.
Homes are increasingly selling below asking price because there are fewer buyers, who are less frantic and less inclined to enter bidding wars unless a home is priced correctly. While supply is growing, it remains near a historic low. Redfin reports an 8.2% year-over-year increase in new listings nationwide, but pending home sales are down 4.3%, marking the biggest decline in four months. Most inventory is becoming stale, with over 60% of homes listed for at least a month without going under contract.
Redfin reports declining demand, with buyers who are stepping back due to soaring housing costs. The median home-sale price has risen 4.9% year over year, reaching a record high of $397,250. Although mortgage rates have decreased from May’s six-month peak, the weekly average remains close to 7%. The typical homebuyer’s monthly payment is $2,785, only about $50 below the all-time high.
Redfin also suggested that buyers may get a slight respite soon on costs soon. The growing likelihood that homes sell below asking price, along with the high share of sellers dropping their prices, could mean sale-price growth loses momentum. Plus, mortgage rates may decrease further if inflation continues to cool.
Agents across the country are reporting similar trends. The most sought-after properties are either move-in ready or complete fixer-uppers. Homes that are decent but not updated are staying on the market the longest. Buyers lack the funds to renovate these homes, but property flippers are eager to purchase and renovate them for resale.

The Best Time To Lower The Price In A Home Sale

Want to Sell Your Home Quickly and Profitably? Watch This Now
Time-Lapse Tree Removal!

What Does A Realtor Earn?

How To Sell Your House When You Are In A Hurry

Do's And Don'ts During The Home Loan Process

7 Tips On Buying A Home With A Pool

How much house can you actually afford (By Income)?