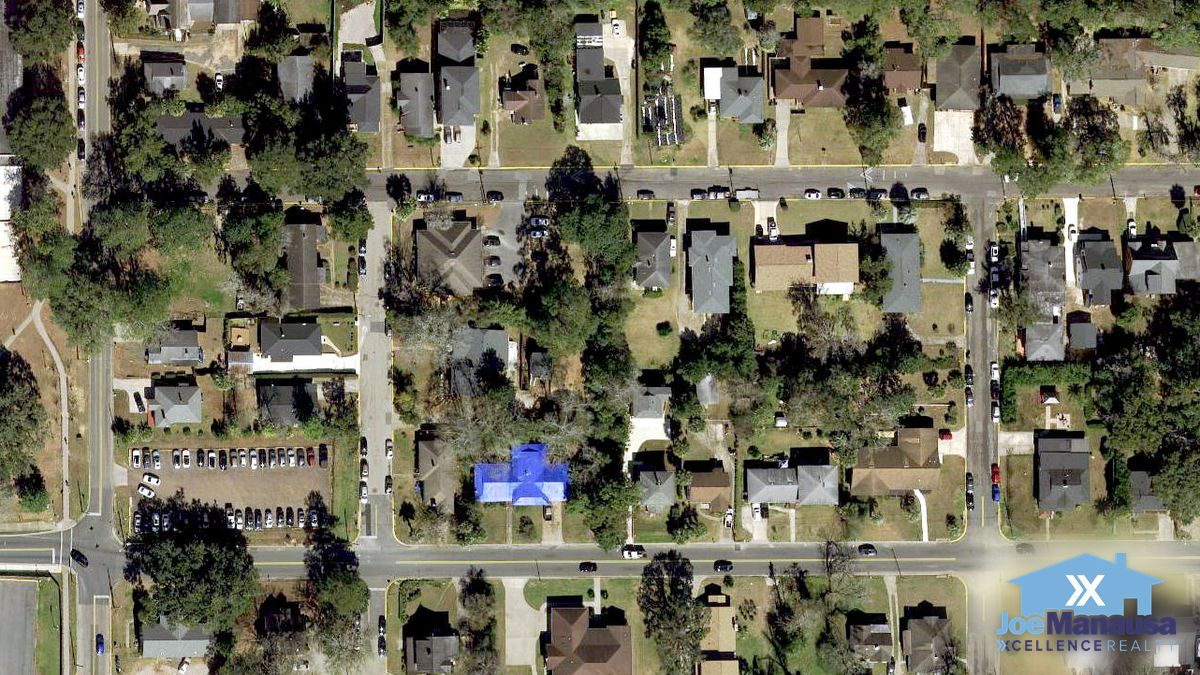
Over the past 12 months, the median home price in Florida A & M was $150,000.
How Much Do Florida A & M Homes Sell For?
Median price of the homes sold each year in Florida A & M, existing homes and new construction, with 2026 covering January to November
Medians describe the homes that sold each year, not the value of any one home.
A dot on its own marks a year with sales but no sales the year before or after.
Sources: Tallahassee Board of Realtors Multiple Listing Service and the Leon County Property Appraiser. Sales updated November 7, 2026.
New construction and existing homes are always charted separately, so a year's new-construction figure can come from just one or two sales.
Medians describe the homes that sold each year, not the value of any one home.
Annual figures
Median sale price, by closing year| Year | Florida A & M existing homes | Florida A & M new construction | Leon County existing homes | Leon County new construction | Florida A & M sales (existing / new) |
|---|
| 2026 | $230,000 | | $305,000 | $436,900 | 7 / 0 |
|---|
| 2025 | $185,000 | | $289,600 | $419,900 | 3 / 0 |
|---|
| 2024 | $360,000 | | $288,500 | $416,150 | 3 / 0 |
|---|
| 2023 | $184,950 | | $270,000 | $410,700 | 4 / 0 |
|---|
| 2022 | $180,000 | | $245,000 | $415,750 | 1 / 0 |
|---|
| 2021 | $115,000 | | $225,000 | $325,000 | 3 / 0 |
|---|
| 2020 | $140,000 | | $215,000 | $302,150 | 1 / 0 |
|---|
| 2019 | $78,250 | | $195,000 | $279,900 | 2 / 0 |
|---|
| 2018 | $250,000 | | $188,000 | $310,500 | 1 / 0 |
|---|
| 2017 | $58,500 | | $185,000 | $285,400 | 1 / 0 |
|---|
| 2016 | $121,500 | | $178,400 | $289,000 | 2 / 0 |
|---|
| 2015 | | | $178,250 | $269,850 | 0 / 0 |
|---|
| 2014 | $47,500 | | $176,000 | $276,100 | 1 / 0 |
|---|
| 2013 | $115,000 | | $175,000 | $282,900 | 1 / 0 |
|---|
| 2012 | | | $169,000 | $270,900 | 0 / 0 |
|---|
| 2011 | | | $167,800 | $244,650 | 0 / 0 |
|---|
| 2010 | | | $170,000 | $192,000 | 0 / 0 |
|---|
| 2009 | $152,000 | | $168,000 | $184,500 | 1 / 0 |
|---|
| 2008 | $230,000 | | $177,500 | $202,250 | 2 / 0 |
|---|
| 2007 | $168,100 | | $179,600 | $193,500 | 1 / 0 |
|---|
| 2006 | | | $176,500 | $183,500 | 0 / 0 |
|---|
| 2005 | $142,500 | | $166,050 | | 1 / 0 |
|---|
| 2004 | $56,100 | | $149,000 | | 1 / 0 |
|---|
| 2003 | $55,000 | | $134,900 | | 1 / 0 |
|---|
| 2002 | $47,500 | | $122,000 | | 2 / 0 |
|---|
| 2001 | $58,000 | | $115,000 | | 1 / 0 |
|---|
| 2000 | | | $105,000 | | 0 / 0 |
|---|
| 1999 | $30,000 | | $102,000 | | 1 / 0 |
|---|
| 1998 | | | $99,000 | | 0 / 0 |
|---|
| 1997 | $71,750 | | $90,000 | | 2 / 0 |
|---|
| 1996 | $60,000 | | $90,000 | | 1 / 0 |
|---|
| 1995 | $65,000 | | $85,000 | | 3 / 0 |
|---|
| 1994 | $36,750 | | $79,000 | | 2 / 0 |
|---|
| 1993 | | | $77,500 | | 0 / 0 |
|---|
| 1992 | $44,000 | | $73,300 | | 1 / 0 |
|---|
| 1991 | | | $68,500 | | 0 / 0 |
|---|
| 1990 | $38,000 | | $68,000 | | 4 / 0 |
|---|
| 1989 | | | $63,000 | | 0 / 0 |
|---|
| 1988 | | | $61,850 | | 0 / 0 |
|---|
| 1987 | $46,750 | | $61,400 | | 2 / 0 |
|---|
| 1986 | $37,800 | | $59,500 | | 2 / 0 |
|---|
| 1985 | $36,500 | | $58,900 | | 2 / 0 |
|---|
| 1984 | | | $55,000 | | 0 / 0 |
|---|
| 1983 | $64,500 | | $54,000 | | 1 / 0 |
|---|
| 1982 | $22,000 | | $54,500 | | 4 / 0 |
|---|
| 1981 | $49,000 | | $51,300 | | 2 / 0 |
|---|
| 1980 | | | $47,500 | | 0 / 0 |
|---|
| 1979 | $32,500 | | $44,500 | | 2 / 0 |
|---|
| 1978 | $25,700 | | $40,000 | | 1 / 0 |
|---|
| 1977 | | | $37,000 | | 0 / 0 |
|---|
| 1976 | $42,000 | | $35,500 | | 1 / 0 |
|---|
| 1975 | $26,000 | | $36,500 | | 1 / 0 |
|---|
| 1974 | | | $32,300 | | 0 / 0 |
|---|
| 1973 | $17,000 | | $28,500 | | 1 / 0 |
|---|
Home value means price per square foot, which takes the size of the home out of the comparison. Over the past 12 months, the median home value in Florida A & M was $113 per square foot, 44% below the Leon County median of $200. The mix of home types that sell each year moves this figure, so it shows the trend in Florida A & M and not the value of any one home.
How Much Are Florida A & M Homes Worth?
Median home value, in price per square foot, each year in Florida A & M, existing homes and new construction, with 2026 covering January to November
Medians describe the homes that sold each year, not the value of any one Florida A & M home.
A dot on its own marks a year with sales but no sales the year before or after.
Sources: Tallahassee Board of Realtors Multiple Listing Service and the Leon County Property Appraiser. Sales updated November 7, 2026.
New construction and existing homes are always charted separately, so a year's new-construction figure can come from just one or two sales.
The Leon County line on each chart shows whether a change in Florida A & M is local or county-wide.
Annual figures
Median price per square foot, by closing year| Year | Florida A & M existing homes | Florida A & M new construction | Leon County existing homes | Leon County new construction | Florida A & M sales (existing / new) |
|---|
| 2026 | $129 | | $199 | $236 | 7 / 0 |
|---|
| 2025 | $103 | | $194 | $244 | 3 / 0 |
|---|
| 2024 | $141 | | $193 | $239 | 3 / 0 |
|---|
| 2023 | $74 | | $186 | $231 | 4 / 0 |
|---|
| 2022 | $70 | | $170 | $208 | 1 / 0 |
|---|
| 2021 | $84 | | $152 | $183 | 3 / 0 |
|---|
| 2020 | $56 | | $137 | $173 | 1 / 0 |
|---|
| 2019 | $67 | | $126 | $172 | 2 / 0 |
|---|
| 2018 | | | $123 | $171 | 1 / 0 |
|---|
| 2017 | $55 | | $117 | $164 | 1 / 0 |
|---|
| 2016 | $63 | | $113 | $155 | 2 / 0 |
|---|
| 2015 | | | $110 | $152 | 0 / 0 |
|---|
| 2014 | $32 | | $107 | $147 | 1 / 0 |
|---|
| 2013 | | | $105 | $144 | 1 / 0 |
|---|
| 2012 | | | $100 | $137 | 0 / 0 |
|---|
| 2011 | | | $102 | $130 | 0 / 0 |
|---|
| 2010 | | | $109 | $122 | 0 / 0 |
|---|
| 2009 | | | $113 | $127 | 1 / 0 |
|---|
| 2008 | | | $122 | $131 | 2 / 0 |
|---|
| 2007 | | | $129 | $138 | 1 / 0 |
|---|
| 2006 | | | $130 | $136 | 0 / 0 |
|---|
| 2005 | | | | | 1 / 0 |
|---|
| 2004 | | | | | 1 / 0 |
|---|
| 2003 | | | | | 1 / 0 |
|---|
| 2002 | | | | | 2 / 0 |
|---|
| 2001 | | | | | 1 / 0 |
|---|
| 2000 | | | | | 0 / 0 |
|---|
| 1999 | | | | | 1 / 0 |
|---|
| 1998 | | | | | 0 / 0 |
|---|
| 1997 | | | | | 2 / 0 |
|---|
| 1996 | | | | | 1 / 0 |
|---|
| 1995 | | | | | 3 / 0 |
|---|
| 1994 | | | | | 2 / 0 |
|---|
| 1993 | | | | | 0 / 0 |
|---|
| 1992 | | | | | 1 / 0 |
|---|
| 1991 | | | | | 0 / 0 |
|---|
| 1990 | | | | | 4 / 0 |
|---|
| 1989 | | | | | 0 / 0 |
|---|
| 1988 | | | | | 0 / 0 |
|---|
| 1987 | | | | | 2 / 0 |
|---|
| 1986 | | | | | 2 / 0 |
|---|
| 1985 | | | | | 2 / 0 |
|---|
| 1984 | | | | | 0 / 0 |
|---|
| 1983 | | | | | 1 / 0 |
|---|
| 1982 | | | | | 4 / 0 |
|---|
| 1981 | | | | | 2 / 0 |
|---|
| 1980 | | | | | 0 / 0 |
|---|
| 1979 | | | | | 2 / 0 |
|---|
| 1978 | | | | | 1 / 0 |
|---|
| 1977 | | | | | 0 / 0 |
|---|
| 1976 | | | | | 1 / 0 |
|---|
| 1975 | | | | | 1 / 0 |
|---|
| 1974 | | | | | 0 / 0 |
|---|
| 1973 | | | | | 1 / 0 |
|---|
Over the past 12 months, the median home size sold in Florida A & M was 1,780 square feet of heated and cooled space.
How Big Are the Homes That Sell in Florida A & M?
Median home size, in square feet, each year in Florida A & M, existing homes and new construction, with 2026 covering January to November
Medians describe the homes that sold each year, not the value of any one home.
A dot on its own marks a year with sales but no sales the year before or after.
Sources: Tallahassee Board of Realtors Multiple Listing Service and the Leon County Property Appraiser. Sales updated November 7, 2026.
New construction and existing homes are always charted separately, so a year's new-construction figure can come from just one or two sales.
Each point is the median size of the homes that sold that year.
Annual figures
Median size (sq ft), by closing year| Year | Florida A & M existing homes | Florida A & M new construction | Leon County existing homes | Leon County new construction | Florida A & M sales (existing / new) |
|---|
| 2026 | 1,758 | | 1,566 | 1,873 | 7 / 0 |
|---|
| 2025 | 2,198 | | 1,544 | 1,747 | 3 / 0 |
|---|
| 2024 | 2,560 | | 1,522 | 1,786 | 3 / 0 |
|---|
| 2023 | 1,962 | | 1,488 | 1,791 | 4 / 0 |
|---|
| 2022 | 2,560 | | 1,476 | 1,935 | 1 / 0 |
|---|
| 2021 | 1,914 | | 1,502 | 1,807 | 3 / 0 |
|---|
| 2020 | 2,503 | | 1,581 | 1,757 | 1 / 0 |
|---|
| 2019 | 1,217 | | 1,569 | 1,670 | 2 / 0 |
|---|
| 2018 | | | 1,550 | 1,791 | 1 / 0 |
|---|
| 2017 | 1,056 | | 1,594 | 1,744 | 1 / 0 |
|---|
| 2016 | 2,055 | | 1,626 | 1,803 | 2 / 0 |
|---|
| 2015 | | | 1,682 | 1,764 | 0 / 0 |
|---|
| 2014 | 1,469 | | 1,696 | 1,876 | 1 / 0 |
|---|
| 2013 | | | 1,700 | 2,010 | 1 / 0 |
|---|
| 2012 | | | 1,729 | 1,987 | 0 / 0 |
|---|
| 2011 | | | 1,703 | 1,783 | 0 / 0 |
|---|
| 2010 | | | 1,644 | 1,573 | 0 / 0 |
|---|
| 2009 | | | 1,537 | 1,487 | 1 / 0 |
|---|
| 2008 | | | 1,504 | 1,570 | 2 / 0 |
|---|
| 2007 | | | 1,465 | 1,535 | 1 / 0 |
|---|
| 2006 | | | 1,469 | 1,470 | 0 / 0 |
|---|
| 2005 | | | | | 1 / 0 |
|---|
| 2004 | | | | | 1 / 0 |
|---|
| 2003 | | | | | 1 / 0 |
|---|
| 2002 | | | | | 2 / 0 |
|---|
| 2001 | | | | | 1 / 0 |
|---|
| 2000 | | | | | 0 / 0 |
|---|
| 1999 | | | | | 1 / 0 |
|---|
| 1998 | | | | | 0 / 0 |
|---|
| 1997 | | | | | 2 / 0 |
|---|
| 1996 | | | | | 1 / 0 |
|---|
| 1995 | | | | | 3 / 0 |
|---|
| 1994 | | | | | 2 / 0 |
|---|
| 1993 | | | | | 0 / 0 |
|---|
| 1992 | | | | | 1 / 0 |
|---|
| 1991 | | | | | 0 / 0 |
|---|
| 1990 | | | | | 4 / 0 |
|---|
| 1989 | | | | | 0 / 0 |
|---|
| 1988 | | | | | 0 / 0 |
|---|
| 1987 | | | | | 2 / 0 |
|---|
| 1986 | | | | | 2 / 0 |
|---|
| 1985 | | | | | 2 / 0 |
|---|
| 1984 | | | | | 0 / 0 |
|---|
| 1983 | | | | | 1 / 0 |
|---|
| 1982 | | | | | 4 / 0 |
|---|
| 1981 | | | | | 2 / 0 |
|---|
| 1980 | | | | | 0 / 0 |
|---|
| 1979 | | | | | 2 / 0 |
|---|
| 1978 | | | | | 1 / 0 |
|---|
| 1977 | | | | | 0 / 0 |
|---|
| 1976 | | | | | 1 / 0 |
|---|
| 1975 | | | | | 1 / 0 |
|---|
| 1974 | | | | | 0 / 0 |
|---|
| 1973 | | | | | 1 / 0 |
|---|