I’ve been asked recently for my opinion on the number of homes being built in the US. Specifically, people are wondering if the ghost of 2006 has come back to bring more homes to the market than what can be consumed or simply put, they want to know “are we overbuilding America today?”
In order to answer this question, I have assembled data on the homes that have been built in the past as well as those that are being built today, and I’ll show you what the data is telling us about new home construction activity in the US.
Some of our readers might be in local market situations that differ from the US overall, but for the most part, this report will reflect the activity found in the majority of US housing markets.
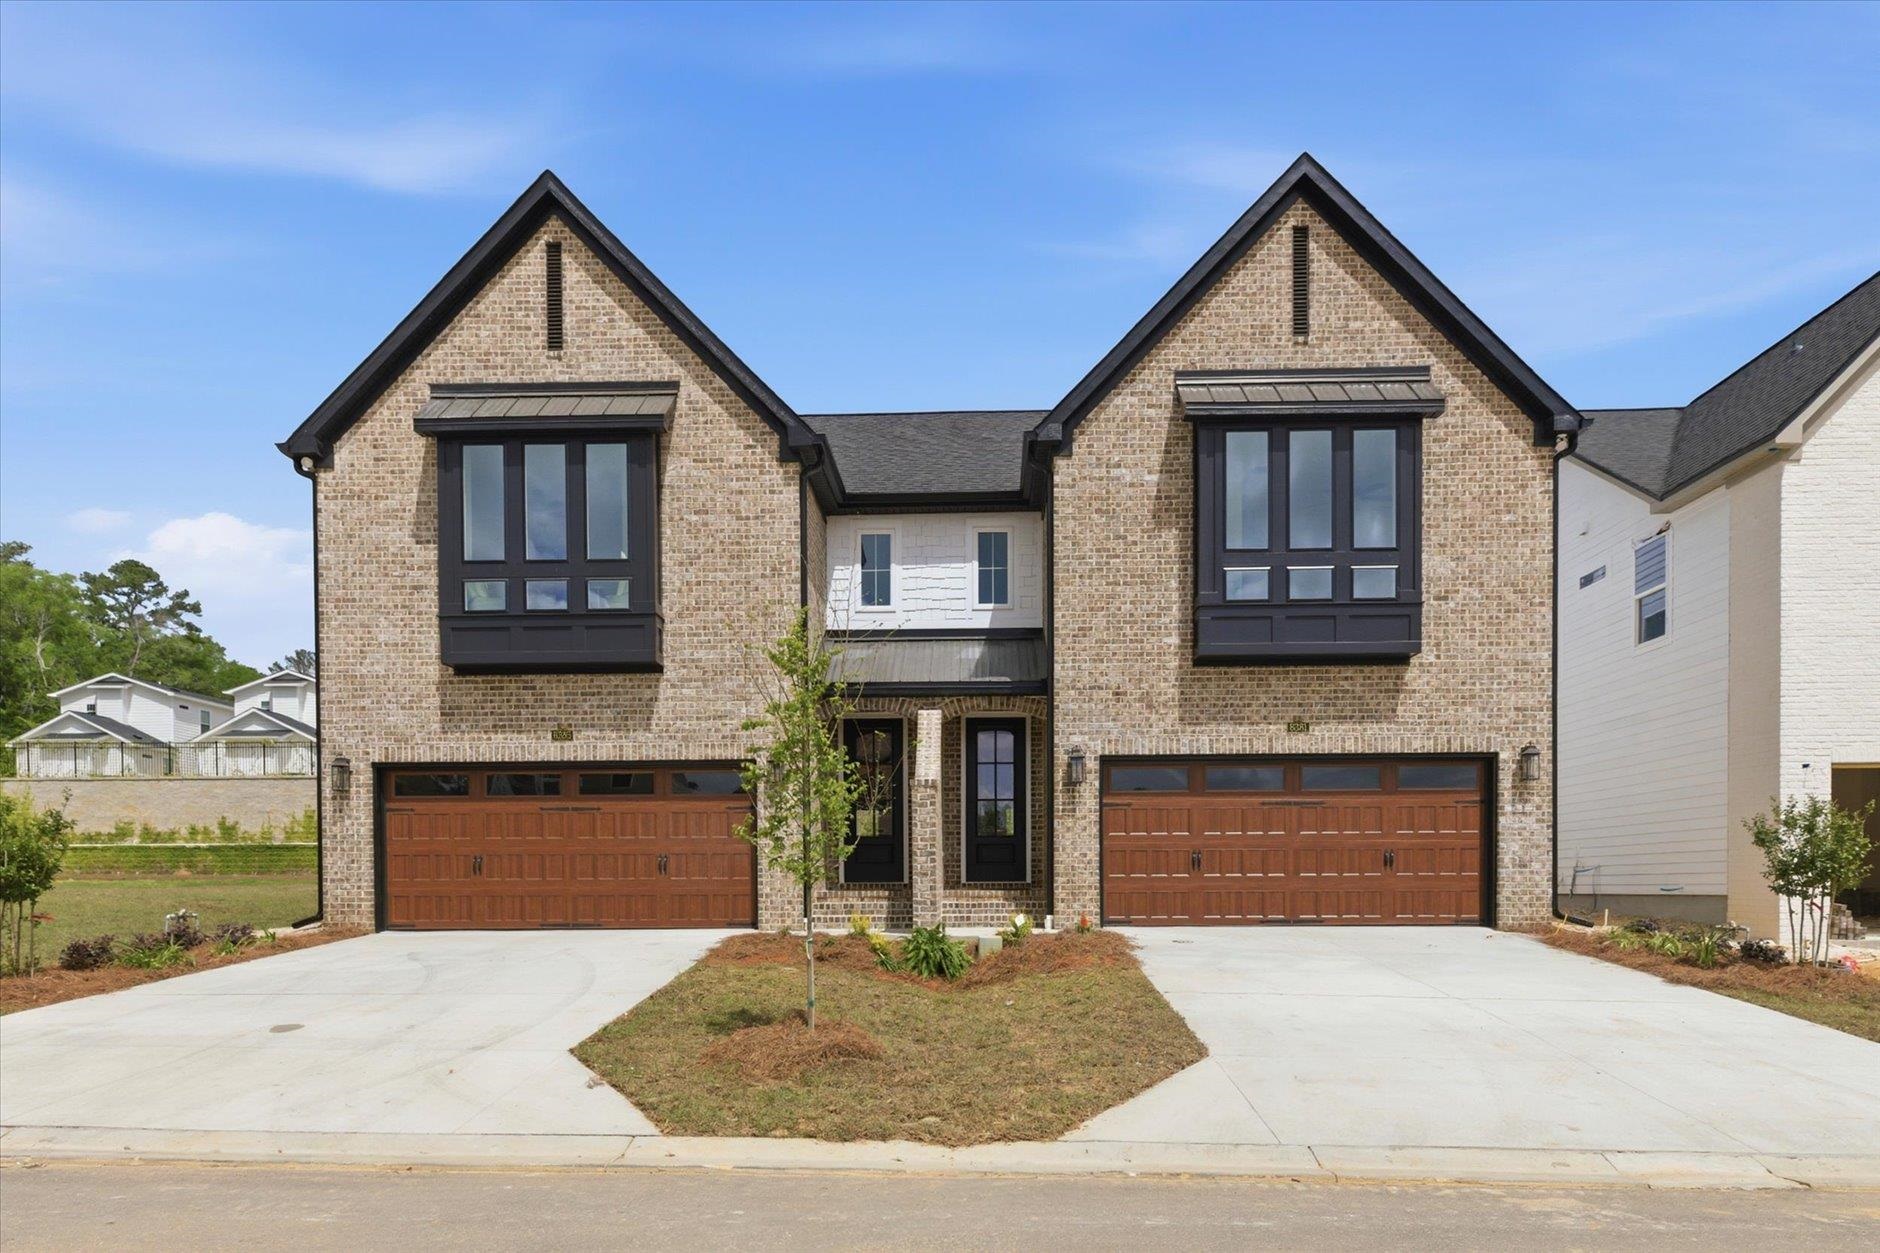
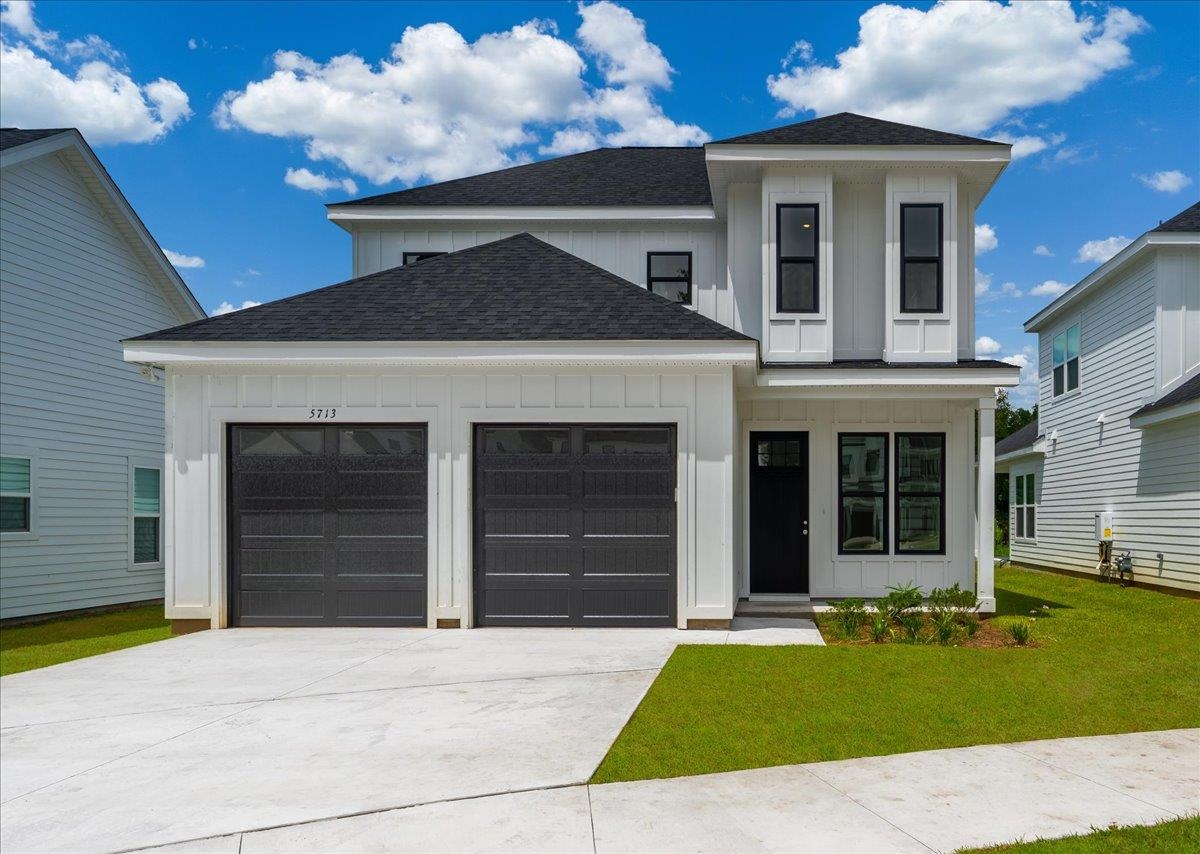
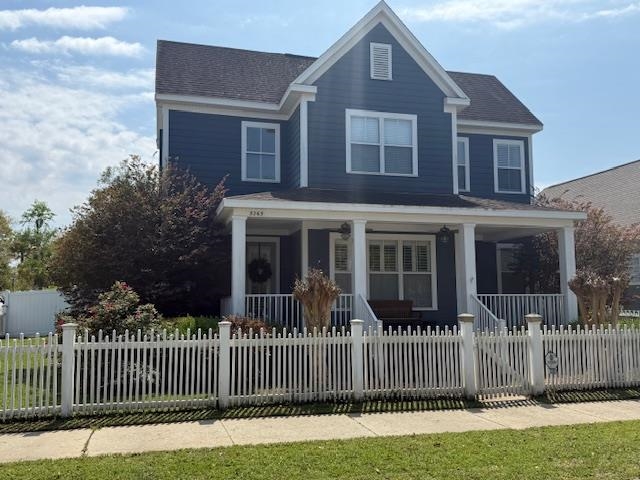
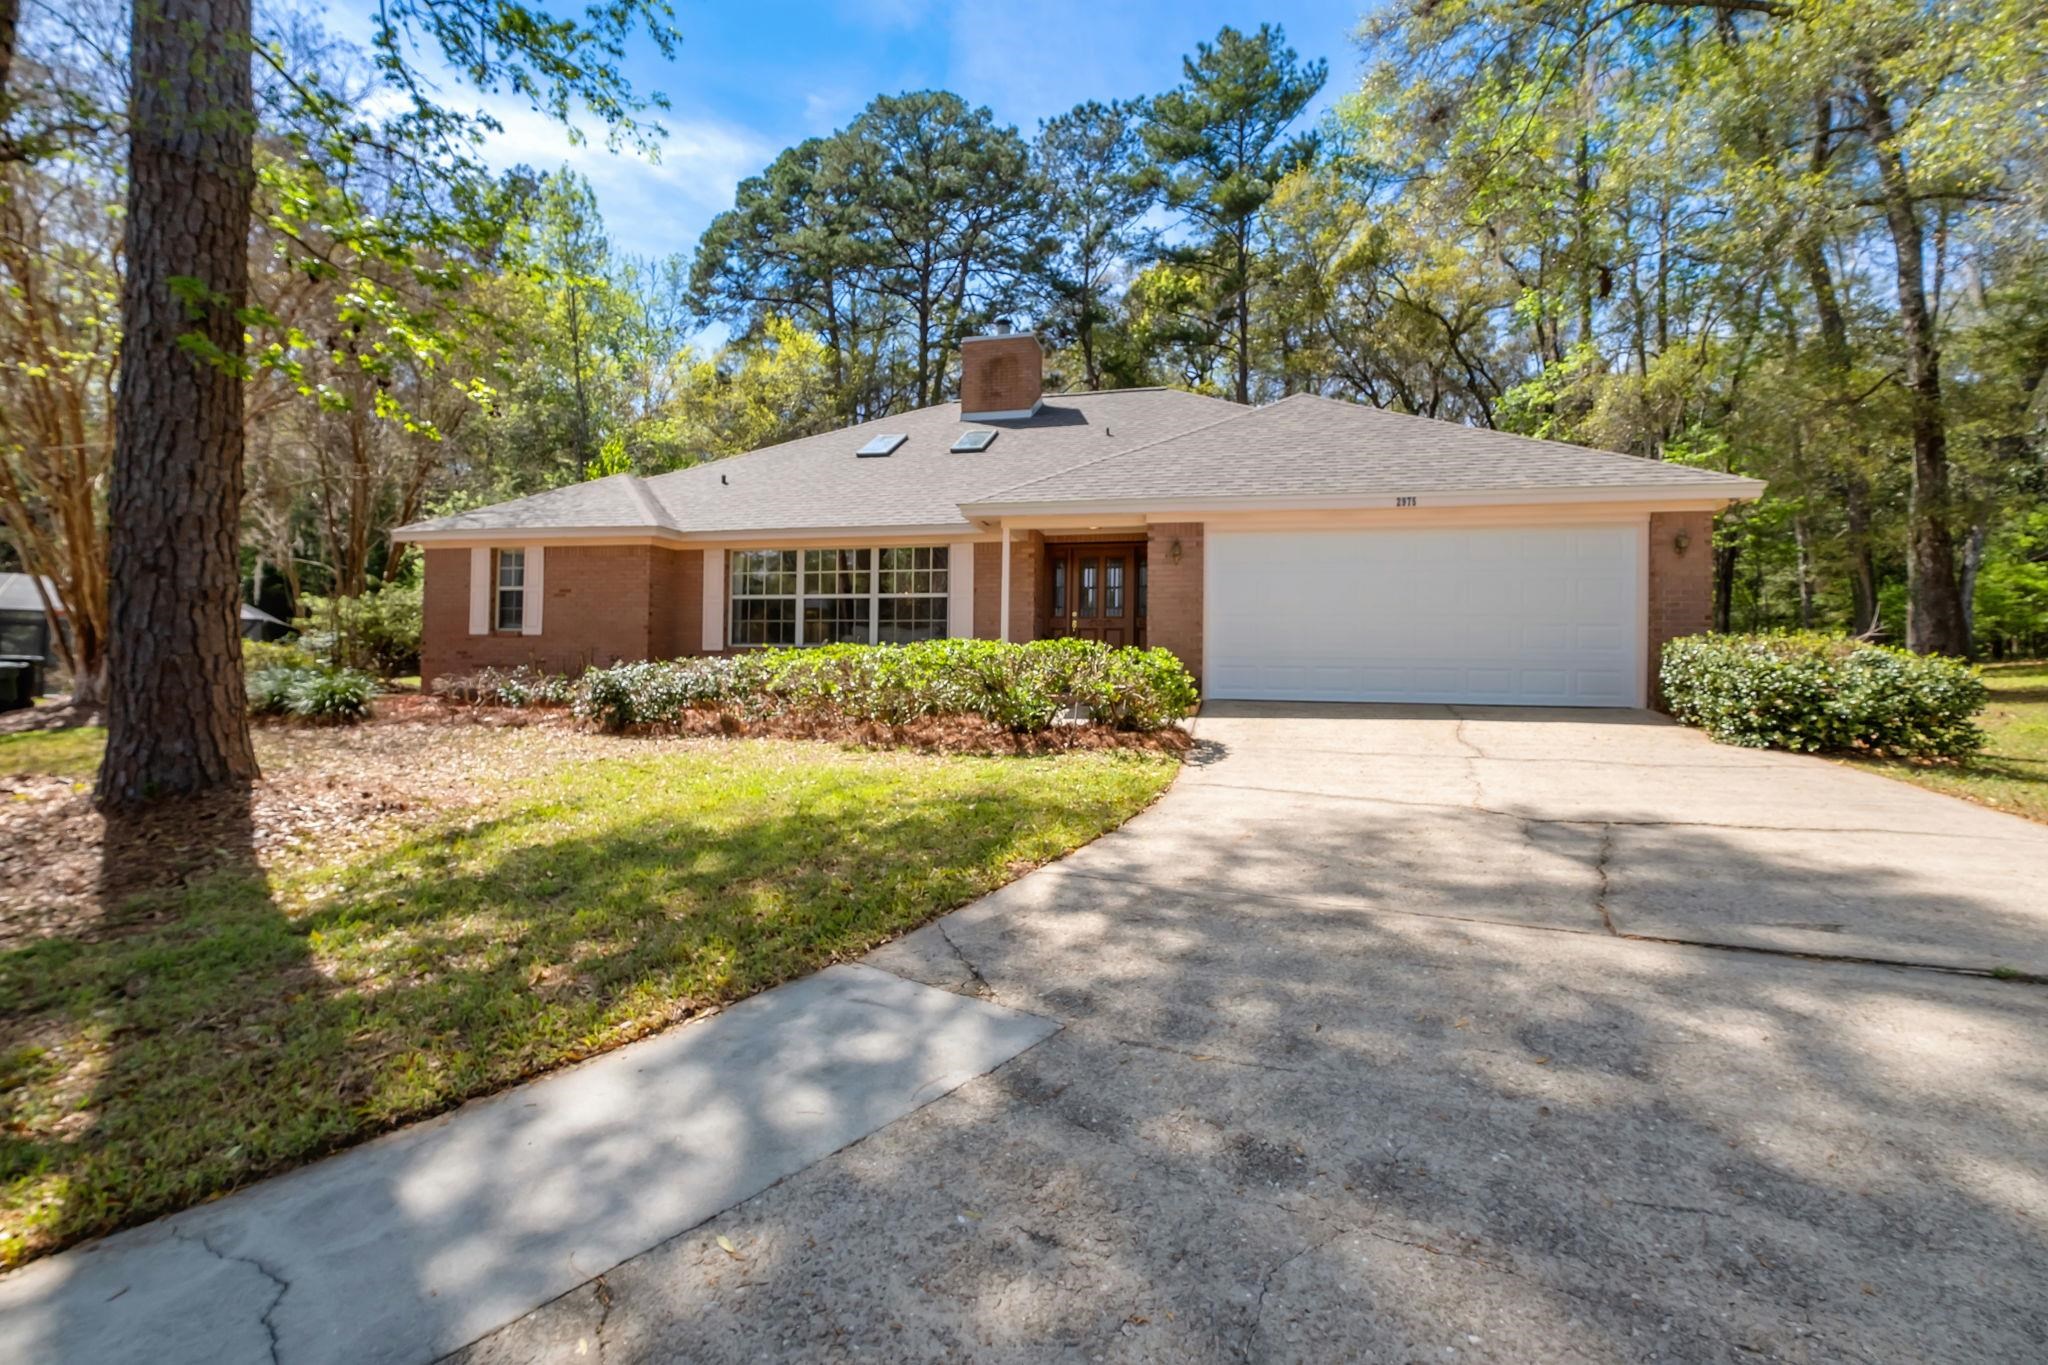
New Construction Listings In Tallahassee
The following list includes all new construction homes for sale in Tallahassee, and you’ll see immediately that it holds far too few homes to alleviate our gross supply imbalance. In fact, Tallahassee’s lack of inventory is consistent with what the majority of US housing markets have been reporting for the past two years.
New Home Construction Listings


Are We Overbuilding America?
How Often Do Home Prices Fall?
I believe that the biggest fear that drives concern about overbuilding stems from memories of the Great Recession of 2008 when home values declined more than 30% before reaching market-bottom. Unfortunately, most people tend to go on recent memory rather than reviewing available data that includes far more history, so let’s start our analysis with the question “how often do home prices fall?”

This graph plots the year-over-year change of the average home price in the US going back more than 130 years to 1890. The average home price is shown in blue while the annual change is plotted with vertical bars: green bars if home prices rose and red bars if home prices declined.
Over the past 100 years, we’ve seen home prices decline substantially three times, but only twice for long-duration declines. The declines occurred after the great depression, the onset of World War II, and then the recent Great Recession of 2008.
That means that we’ve only seen a decline once in the past 80 years, and it lasted five years from 2007 through 2011. I believe this recency bias has people looking for declines around every corner, rather than observing the supply and demand dynamic to help them formulate the most likely direction of home price movement.
The US Population Growth Is Slowing But Growing
When trying to determine the number of homes that need to be built each year, one could start by looking at the change in the US population.

The graph above shows the US population in blue, and the ten-year growth rate in red. From 1960 through 2000, the ten-year growth averaged 11.2% but has since fallen to an average of 9.6% for the past 21 years. This decline would suggest fewer homes are needed than what we have seen previously.
But measuring population change alone does not fully explain what’s going on in the world of people-moving. There are demographic changes that are occurring that can impact the need for homes too.
For example, the U.S. Census found that 12.3 million American households were formed from January 2012 to June 2021, but just 7 million new single-family homes were built during that time. It is this fact that caused realtor.com (in a published study last year) to report a housing shortage of 5.24 million homes.
Population growth and household formation growth has made it clear, more homes are needed.
Recent US Housing Market Reports


Housing Crash or Boom? Here’s What’s Coming in 2025

BIGGEST Housing Market Myth EXPOSED by New Foreclosure Data
How Many New Homes Were Built?
If we want to better visualize the need for new homes, we can start by looking at a graph of the number of homes that have been built over the past 70+ years.

This graph plots the number of new construction homes completed each month. The blue line shows the total number of units, and it is this line that we’ll evaluate.
From 1970 through 2006, the average number of homes built was 129,434 each month (1.55M annually), but that fell to just 84,430 monthly (1.01M annually) over the past fifteen years. That’s a difference of more than 8 million homes when compared to the recent norm.
How Many New Homes Are Under Construction?
This next graph is built on the data that has people concerned that we might be overbuilding America.

Much like the previous graph, this one breaks down homes by type, with the total shown in blue. The blue line has jumped significantly over the past two years, resulting in the highest number of homes under construction than we’ve seen since the 1970s.
Currently, there are roughly 1.6M homes under construction, which is 4x the number seen at the bottom of the housing market ten years ago. Without context, it’s no wonder that many are concerned about over-building.
Get Our Free Market Update

Other buyers, sellers, lenders, and real estate agents have this critical information, and now you can too!
Get immediate access to our most recent newsletter.
Let more than 30 years of experience work for you with charts, graphs, and analysis of the Tallahassee housing market.
Each Monday morning we send out a simple, one-page report that provides a snapshot of the Tallahassee housing market. It only takes 2 minutes to read, but it gives you better market intelligence than most real estate agents possess. Just tell us where to send it below!
How Many New Homes Were Authorized But Not Started?
There is another category of new construction homes that we must include in our count, and it is those homes that have been authorized (permitted in most areas) but have not yet started.

This graph also reports a higher number than we have observed since the 1970s, with an absolute explosion of authorizations occurring within the past two years.
While not every home that gets permitted gets built, this information is still valuable in assessing the pipeline of new construction activity and the potential for new homes being built over the next few years.
How Many New Homes Were In The Pipeline?
When we combine the data from the previous two graphs, it provides a good look at the number of homes in the pipeline.

The graph above shows that there are fewer than 2M homes in the pipeline to help fill the need for new homes needed each year PLUS the 5.24 million homes that comprise the shortage that has caused prices to run out of control.
If all those homes were delivered at once, it would only make a healthy dent in the shortage. Unfortunately, those homes cannot all be delivered right away.
Top Tips For HomeBuyers

Buy Now Or Wait? The 91.6% Rule

Biased Results? The New York Times Rent Or Buy Calculator

Do's And Don'ts During The Home Loan Process

6 Real Estate Contract Terms You Should Not Overlook

7 Tips On Buying A Home With A Pool

How much house can you actually afford (By Income)?

What Does "Marry The House Date The Rate" Mean In Real Estate?

Why Fixer Uppers Are the New Gold | Home Renovation Guide

8 Tips For Buying An Affordable Florida Vacation Home
How Long Does It Take To Build A Home?
This graph gives us an idea of when we should expect to see the new homes that are in the pipeline today.

Even with construction delays, single-family homes are being delivered in about 8 months, while multi-family properties are taking closer to 1.5 years. When we use these numbers to calculate delivery dates, we can deduce the following.
Roughly one million single-family homes and another six hundred thousand multi-family homes should hit the market in 2022. That means we expect 1.6M homes will be added.
If the supply shortage is 5.24M homes and the “average” annual need for new homes sits at about 1.2M homes, we will see the shortage drop from 5.24 M homes to about 4.8M homes. In other words, even with optimistic expectations on the new construction industry to overcome supply chain issues and deliver homes, the US housing market will still have a huge shortfall of homes at the end of this year.
The Rental Market Has A Shortage Too
Most people are going to believe that demand for homes will decline when mortgage interest rates push higher. While this is highly likely in the “for sale” market, it is absolutely not true in the “for rent” market.

This graph was produced from data provided by Zillow. It approximates the median market rental rate since 2015, and lately, rents have been soaring. Why?
Because the low inventory of homes for sale has consumed part of the rental inventory and now the shortage exists in both markets. If consumers get pushed out of purchasing, they will face a rental market that we have never before seen. Rents are soaring now, what will they look like when demand rises due to the fall of home affordability in the “for sale” market?